BI Tool Integration
Demo Video

Client Tool
The screenshots for this demo will leverage the BI Tool of QuickSight. Be sure to complete the BI Tool setup before proceeding.
Challenge
Miguel has been tasked to create a sales dashboard, which by default looks at data across the country, but has the ability to also drill down and focus on specific geographic areas. He also wants the graphs to be able to show a forecast for the next three months. To accomplish these tasks, Miguel will use QuickSight and execute the following steps.
Build the Data Set
| Say | Do | Show |
|---|---|---|
| Joe the DBA has already configured the QuickSight account for the data analysts to use by establishing a data source and sharing it to his power users. Miguel simply needs to log into QuickSight and create a new data set using the Redshfit-Demo data source. | Navigate to QuickSight and Create a new Data Set using the source created earlier. https://us-east-1.quicksight.aws.amazon.com/sn/data-sets/new | 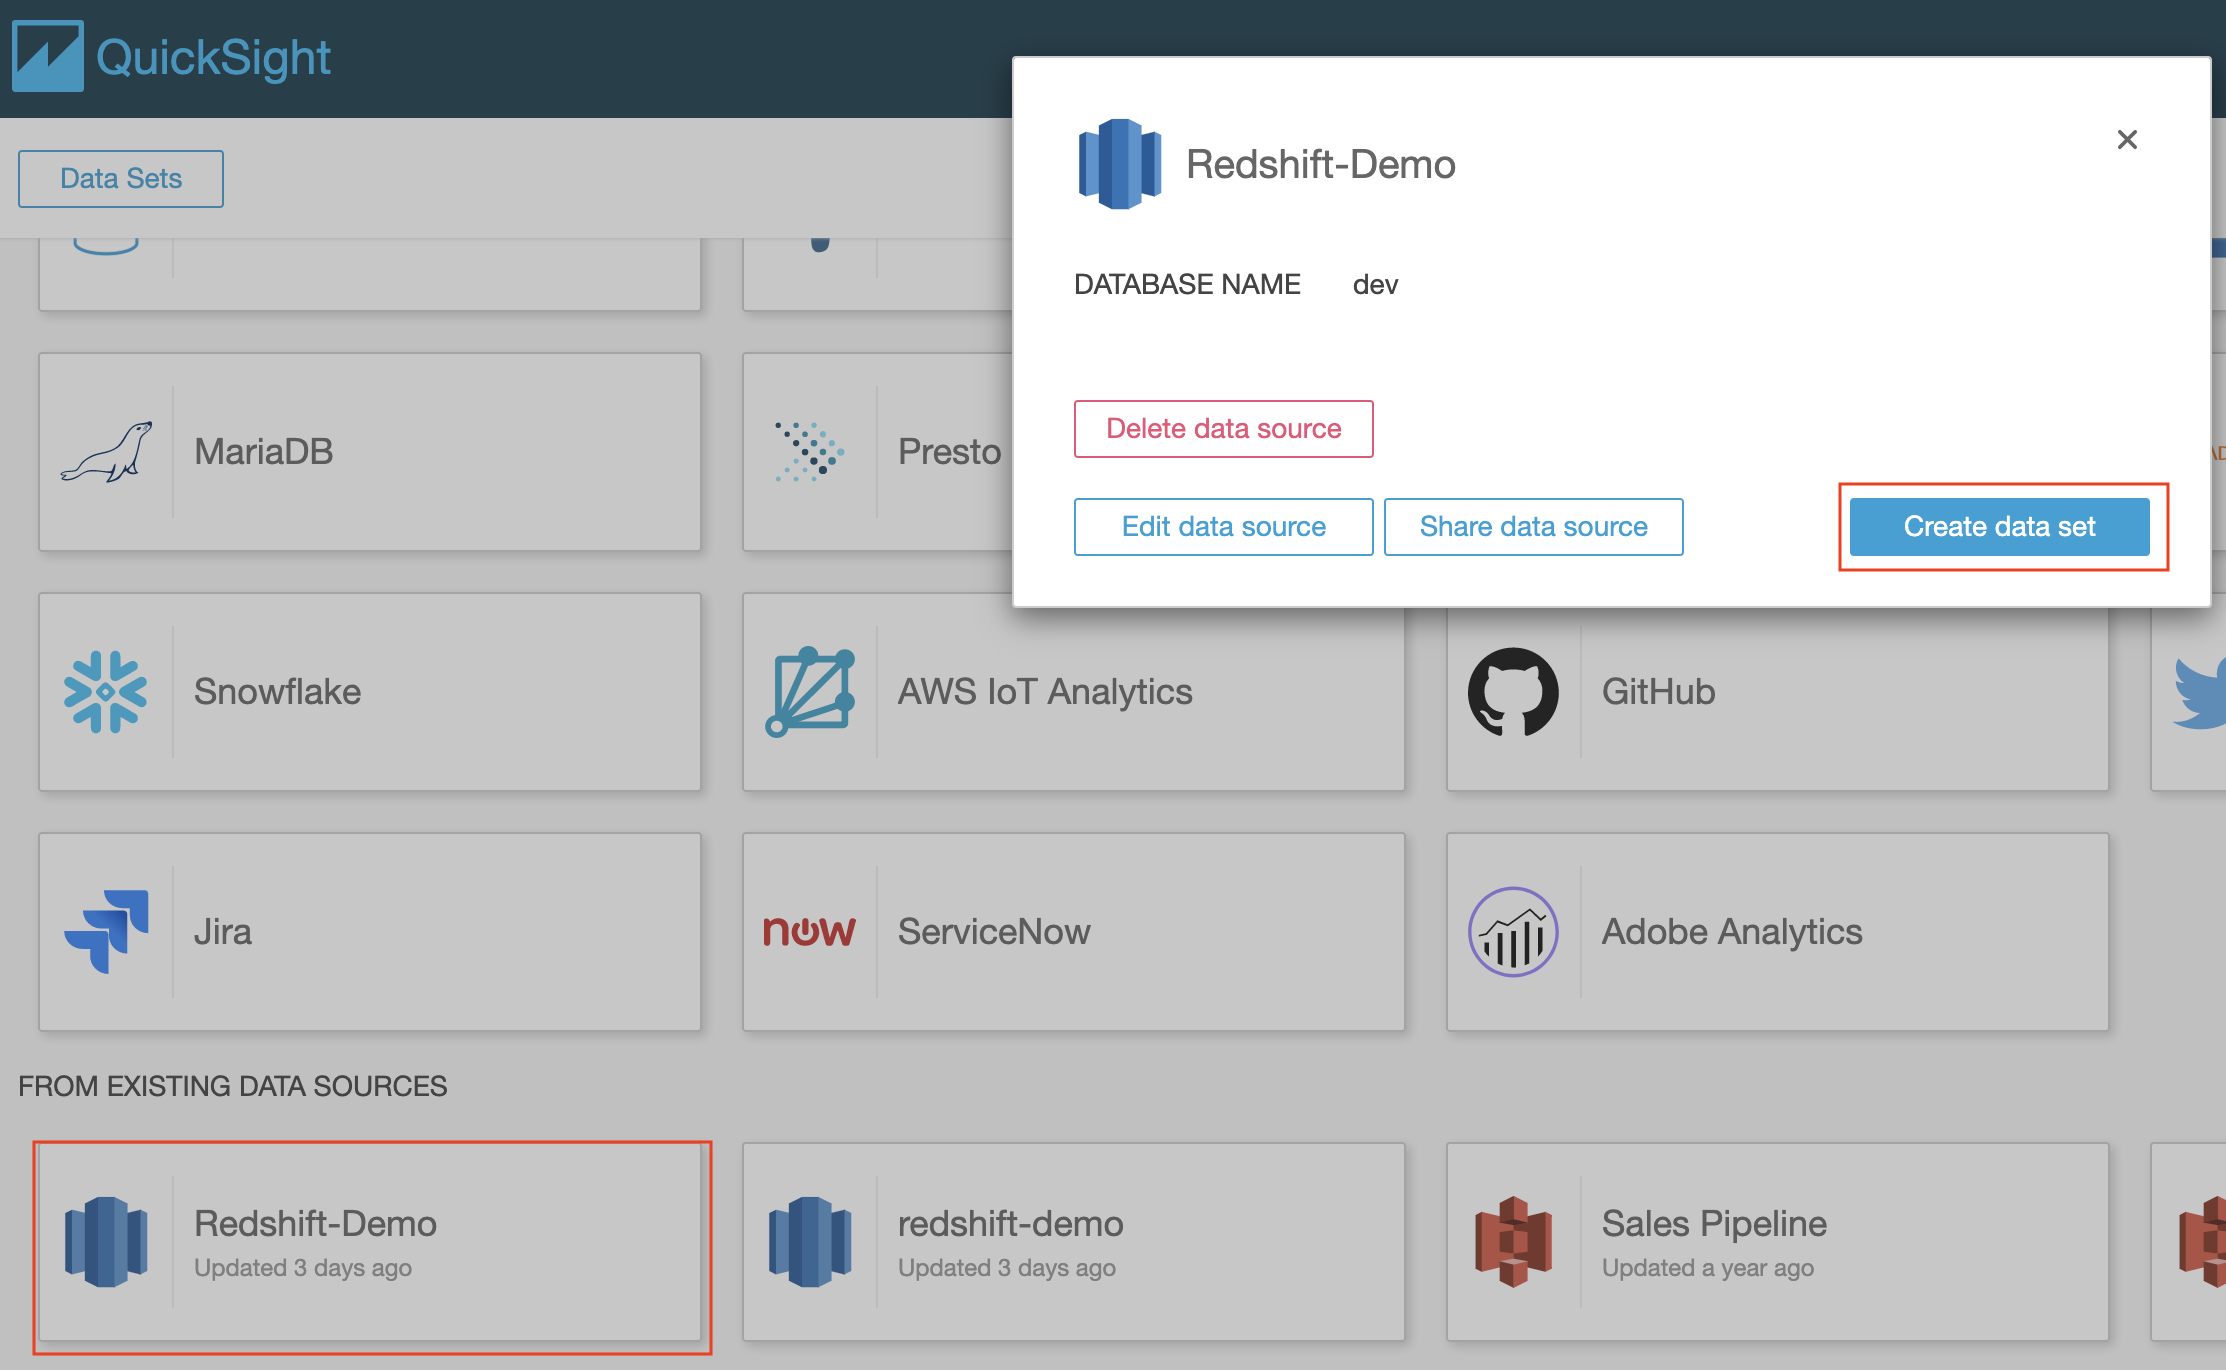 |
| Miguel would like to build a dashboard that looks at Store Sales | Select the public schema and choose the store_sales table. Click on Select | 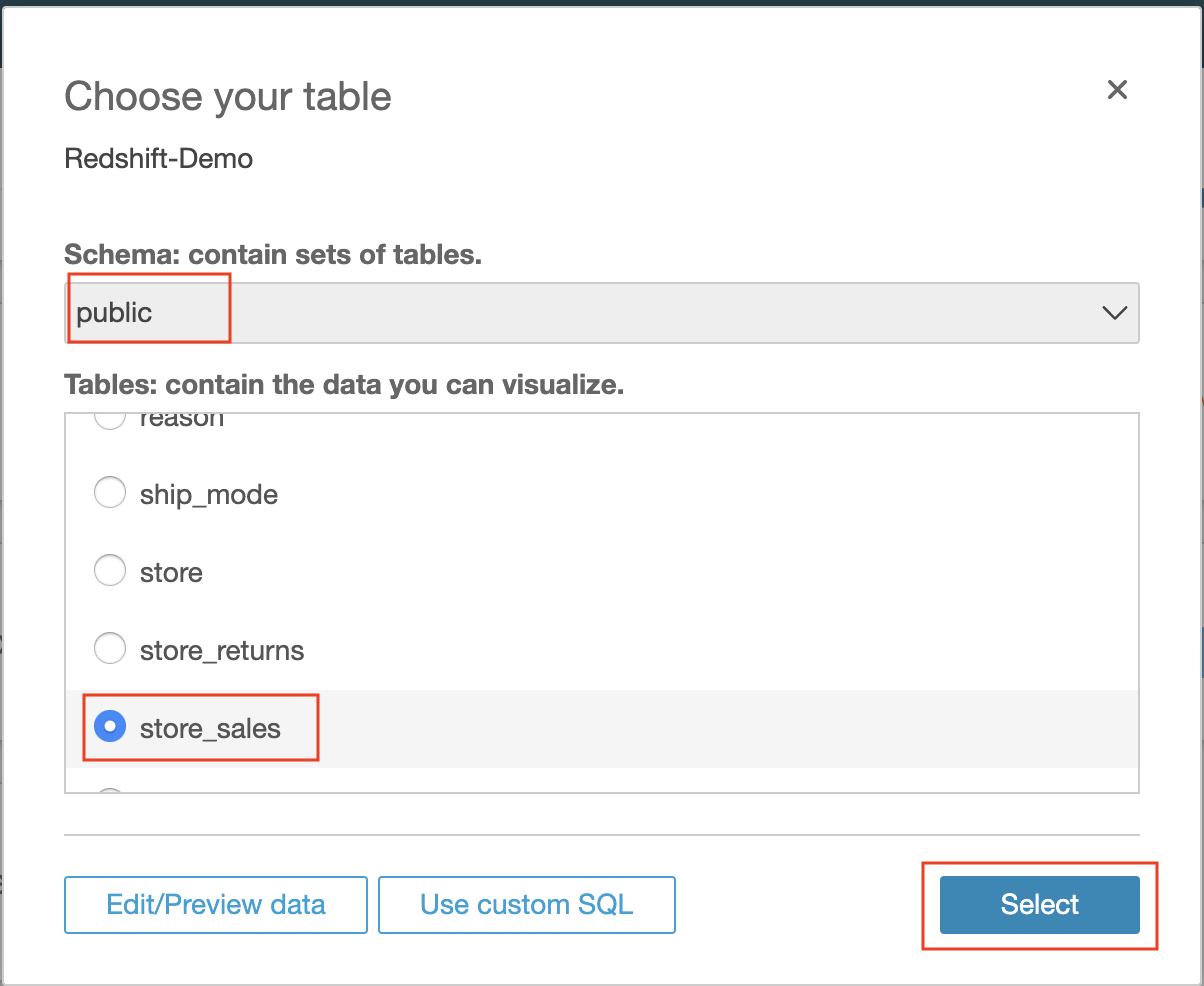 |
| Since this is a large data set, Miguel will have the dashboard directly query the data. | Wait for the Finish data set creation dialog to load. Then click on Edit/Preview Data | 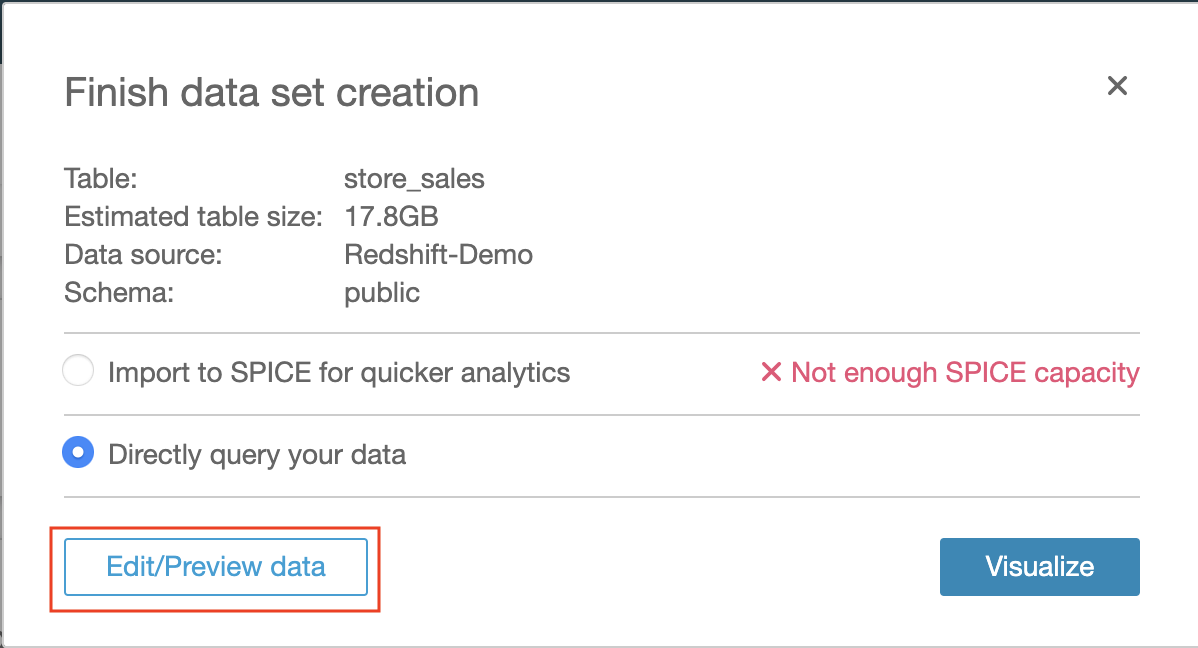 |
| In order to get the fields he needs for his reports, Miguel needs to join the store_sales table with the date_dim, customer_demographics, and store tables. Let’s start with the date_dim. | Click on the Add data link. |  |
| Now, we need to inform QuickSight how to join the store_sales and date_dim tables. | Click on the configure join icon. Choose the columns to be used for the left and right side of the join. Ensure the join type is set to inner and click Apply. |  |
| Next, Miguel needs to join the store_sales table with the customer_demographics. | Click on the Add data link. | 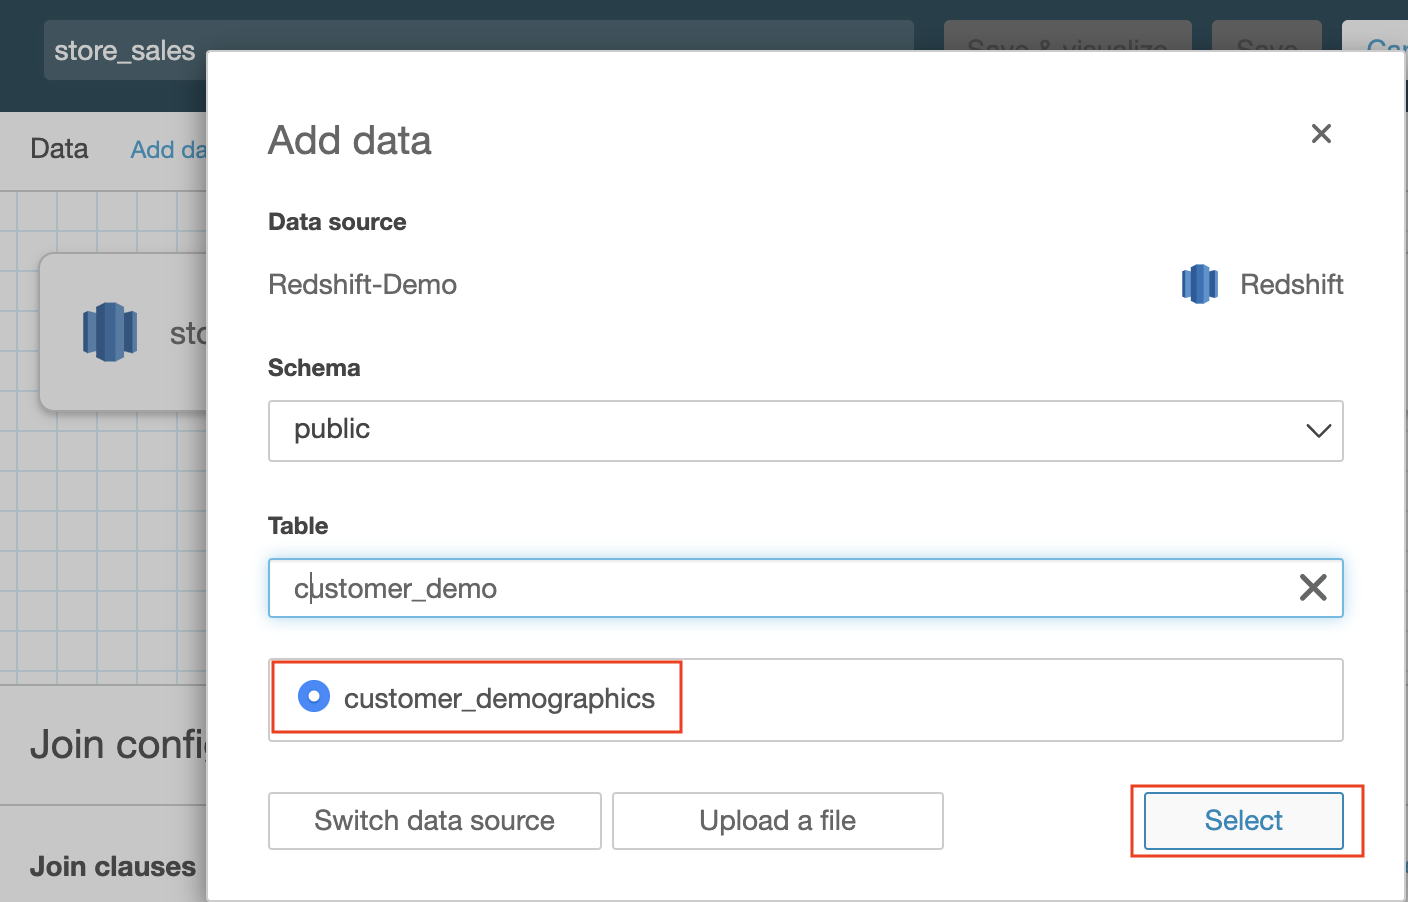 |
| Again, we need to inform QuickSight how to join the store_sales and customer_demographics tables. | Click on the configure join icon. Choose the columns to be used for the left and right side of the join. Ensure the join type is set to inner and click Apply. | 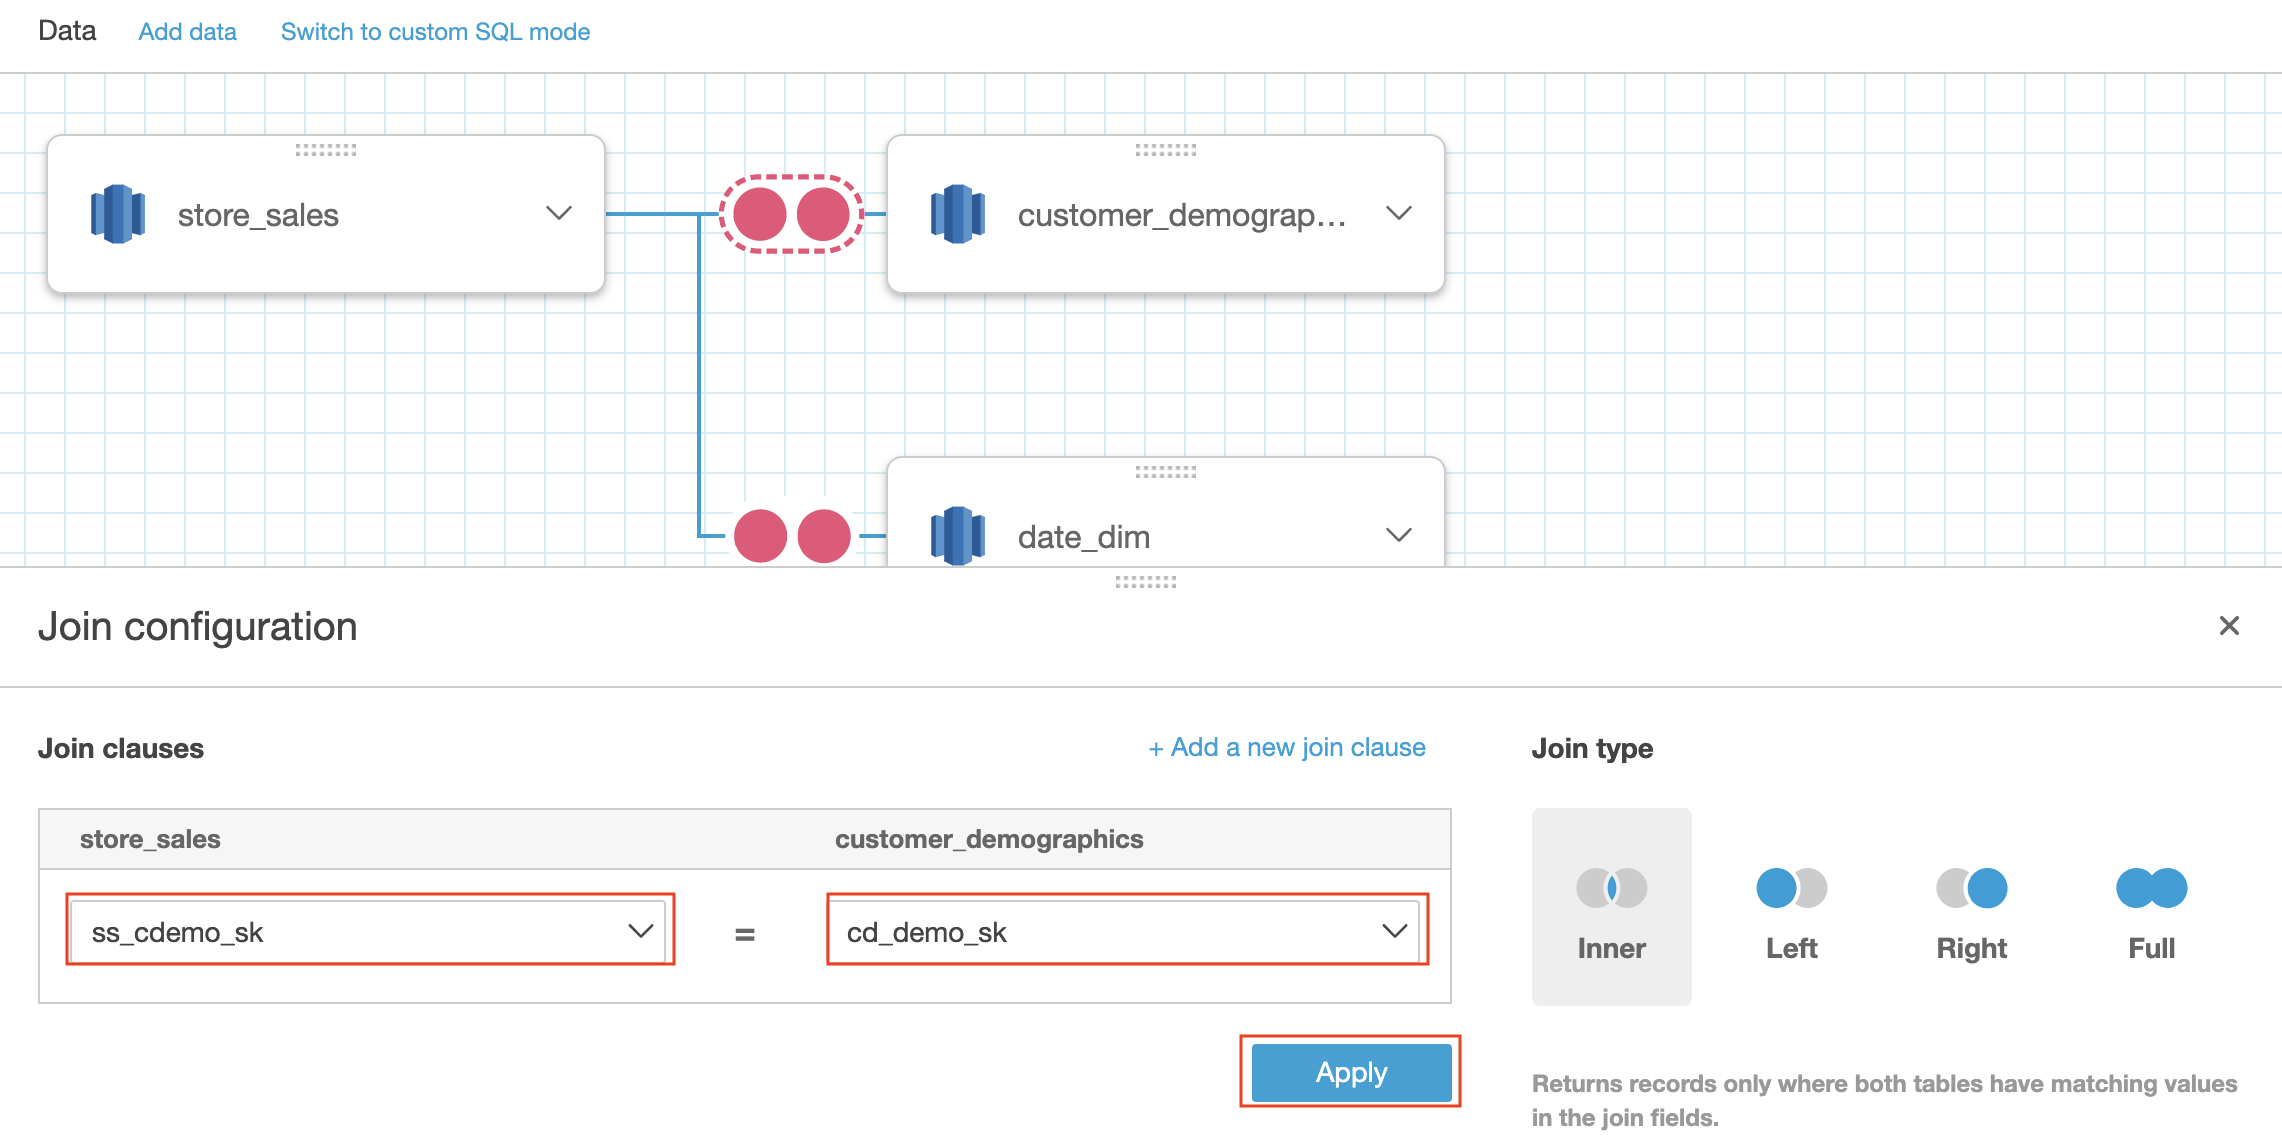 |
| Finally, Miguel needs to join the store_sales table with the store. | Click on the Add data link. |  |
| Inform QuickSight how to join the store_sales and store tables. | Click on the configure join icon. Choose the columns to be used for the left and right side of the join. Ensure the join type is set to inner and click Apply. | 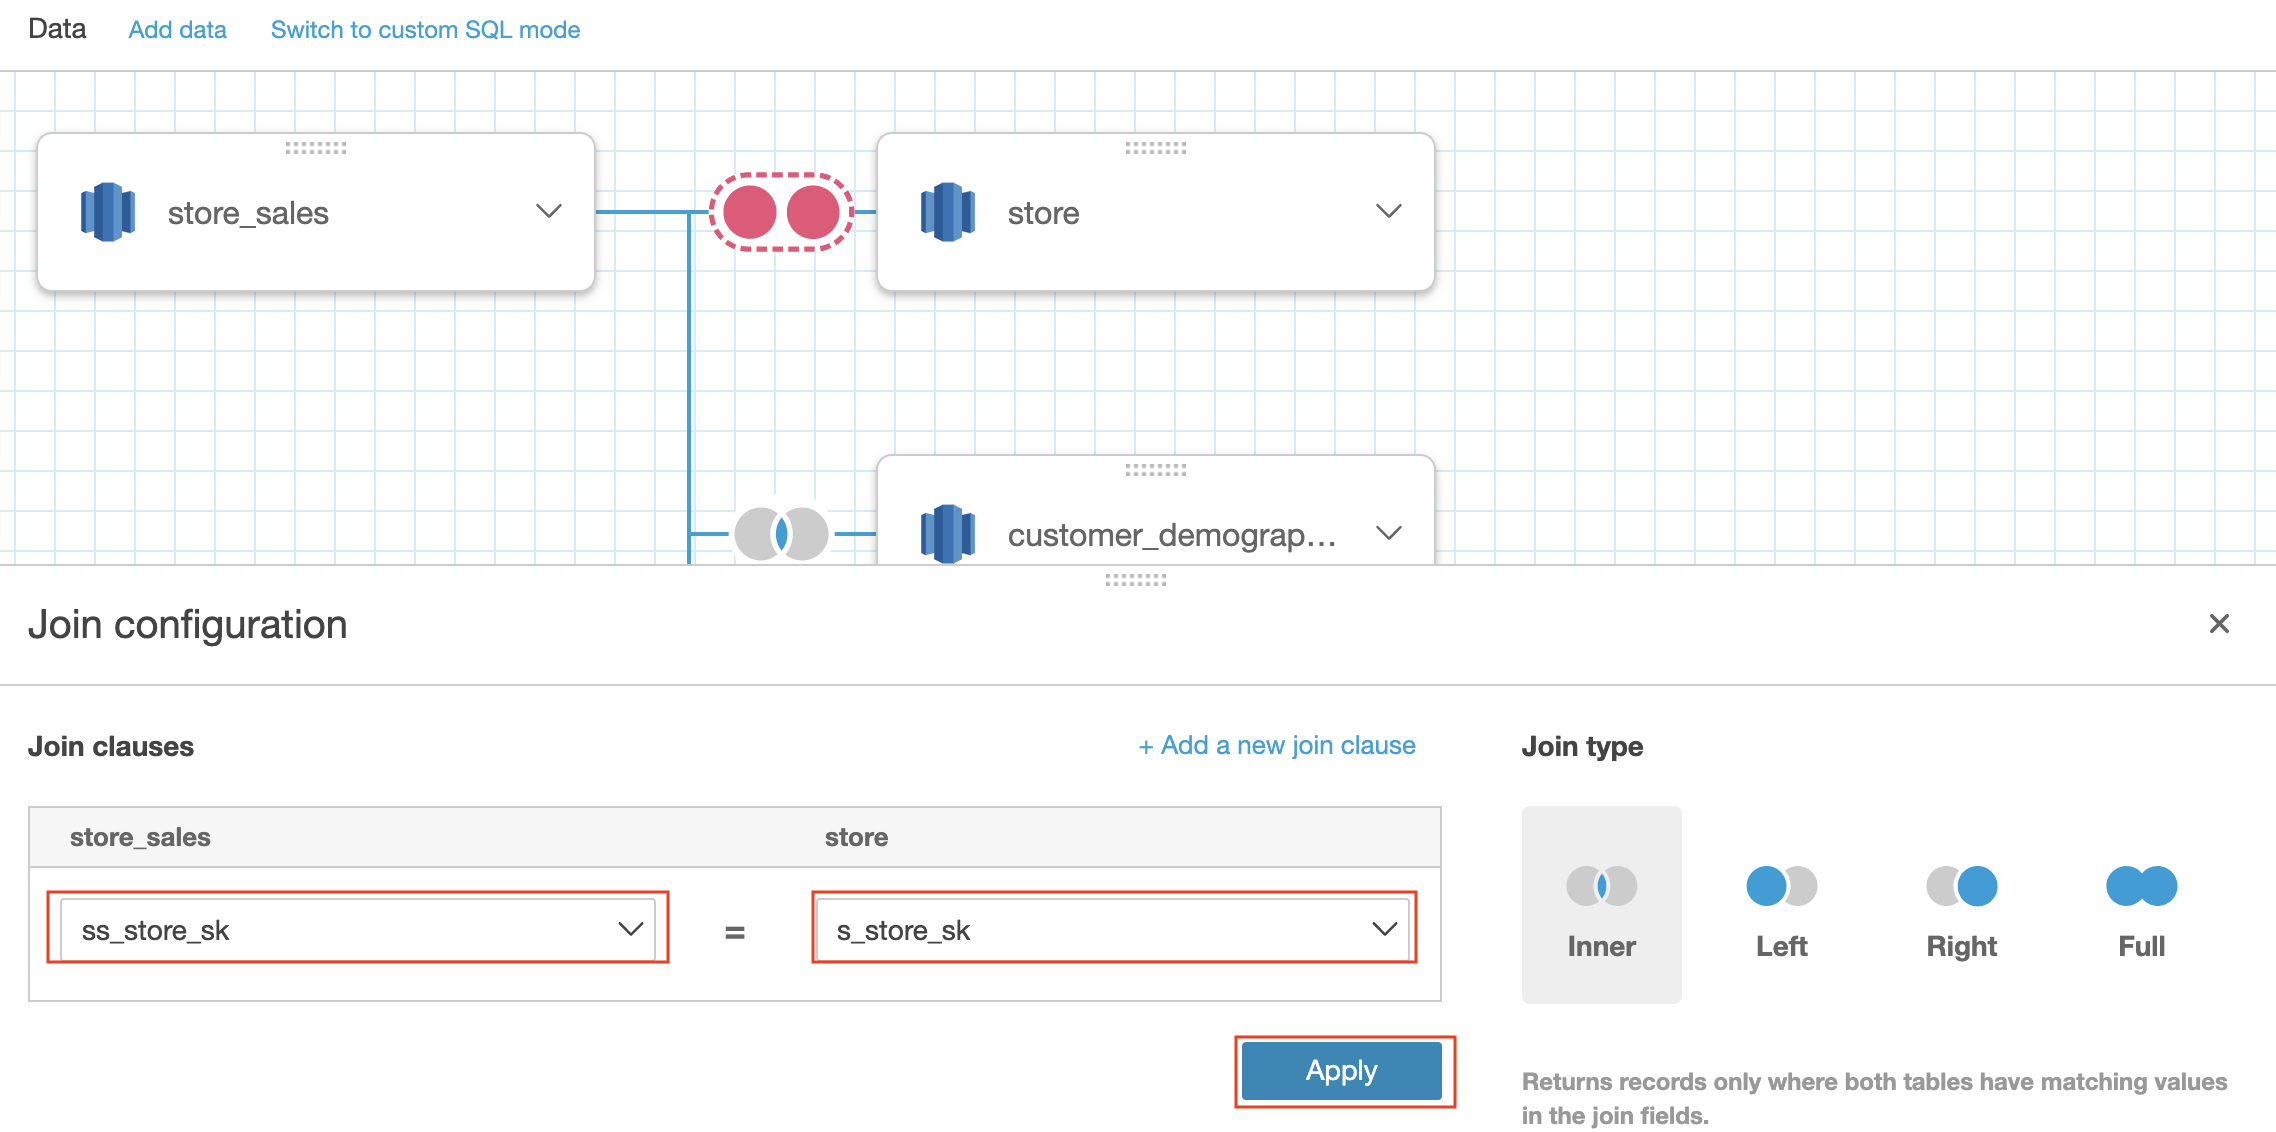 |
| Now that we’ve prepared out store_sales data set, we can proceed to building the dashboard. | Click on the Save & Visualize button | 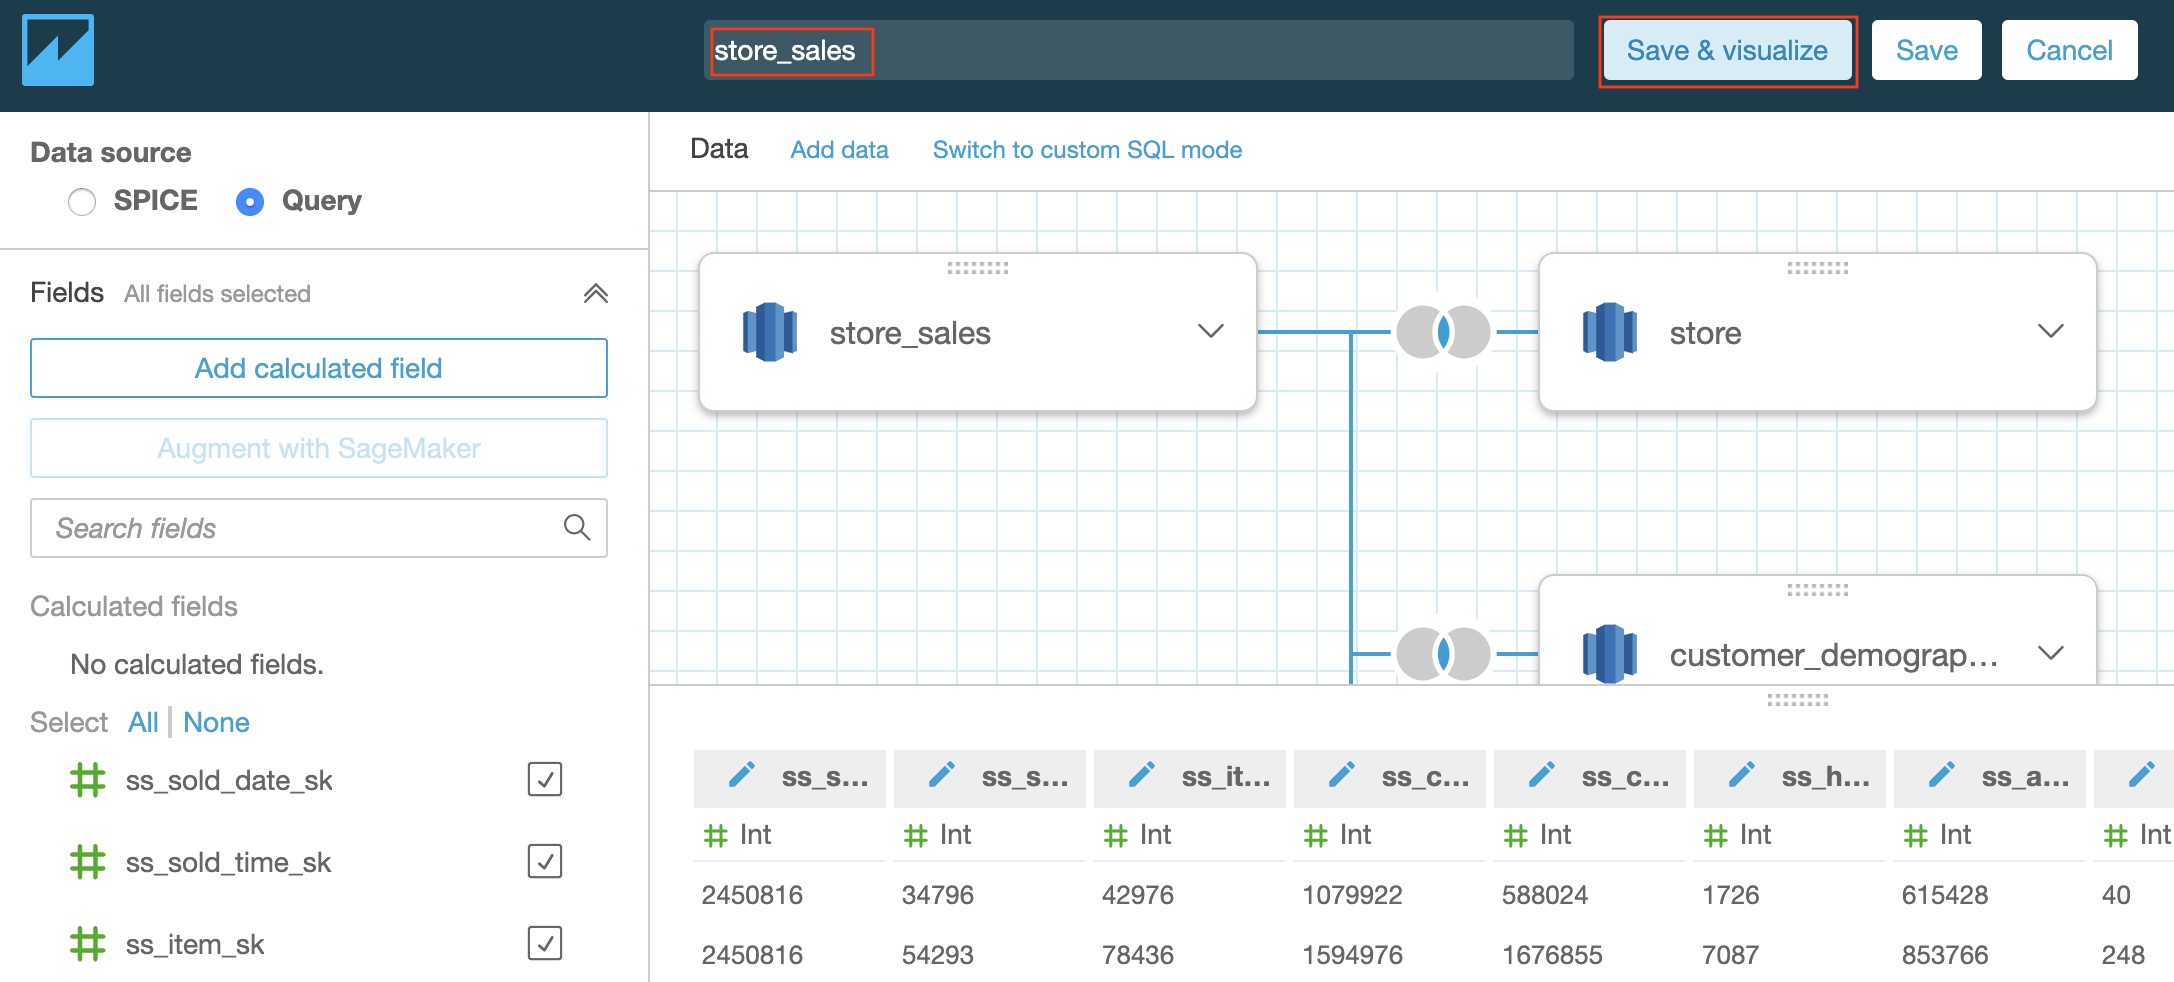 |
Build an Analysis
| Say | Do | Show |
|---|---|---|
| To start the analysis, Miguel will add a couple of fields into an Auto Graph in an attempt to get the revenue by quarter. | On the list of fields, enter into the search the word date. From the results click on the d_date field. Notice, that the graph will generate automatically doing simple count. | 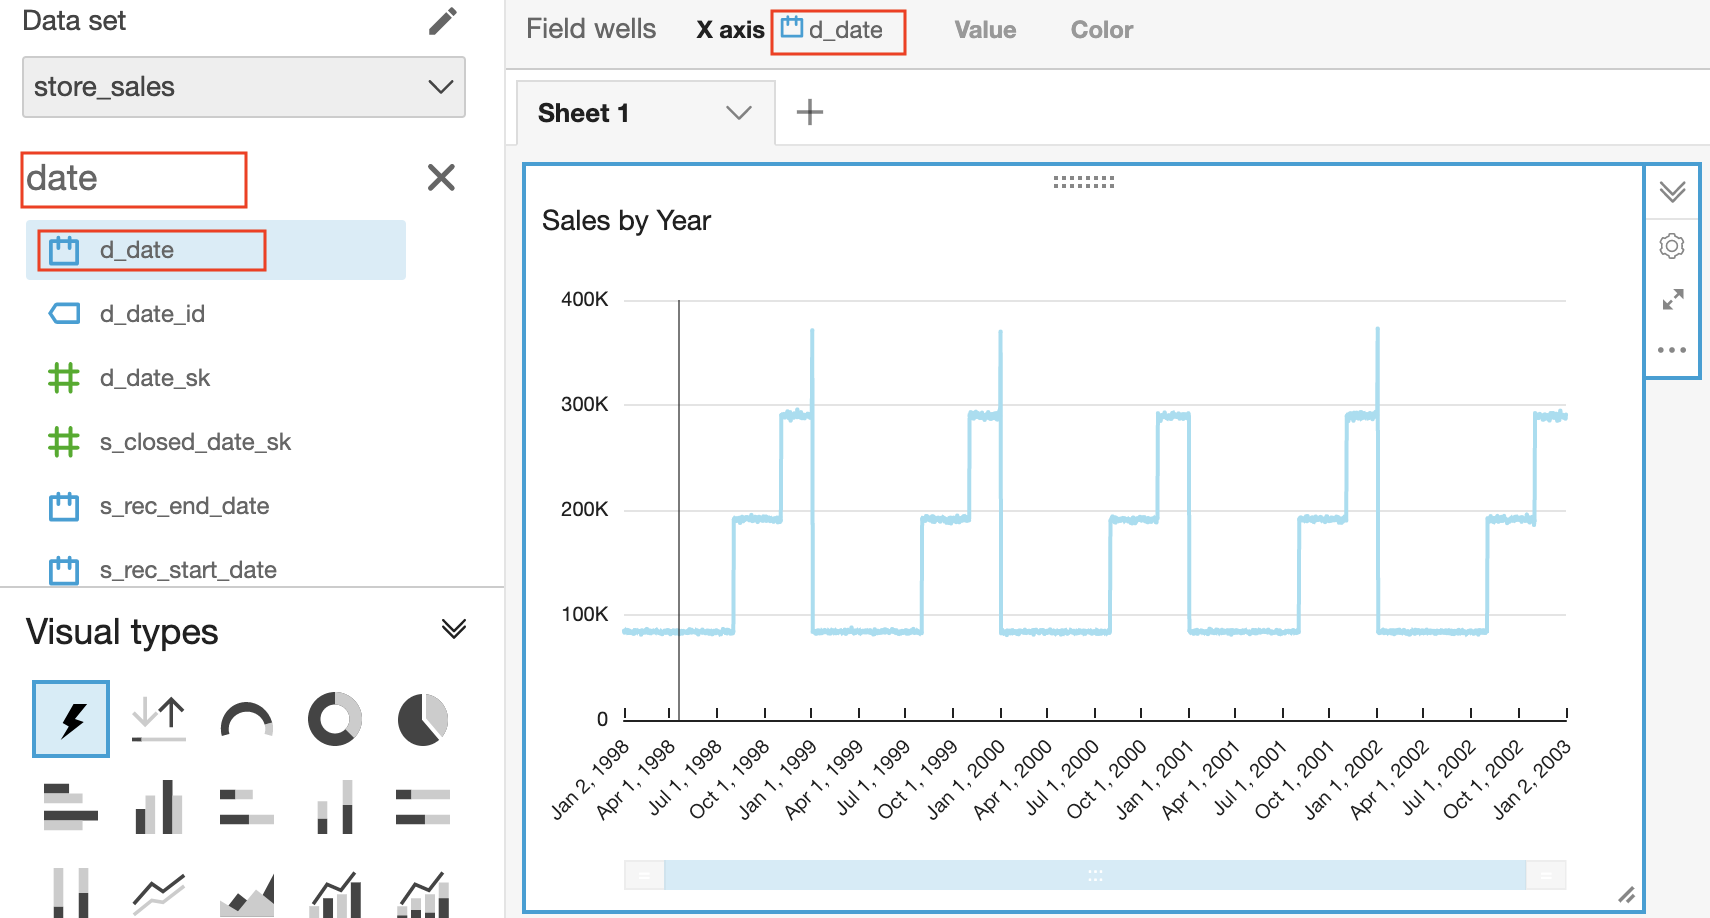 |
| Now, instead of a count, Miguel wants to see the revenue. | On the list of fields, enter into the search box the word paid and click on the ss_net_paid_inc_tax field. | 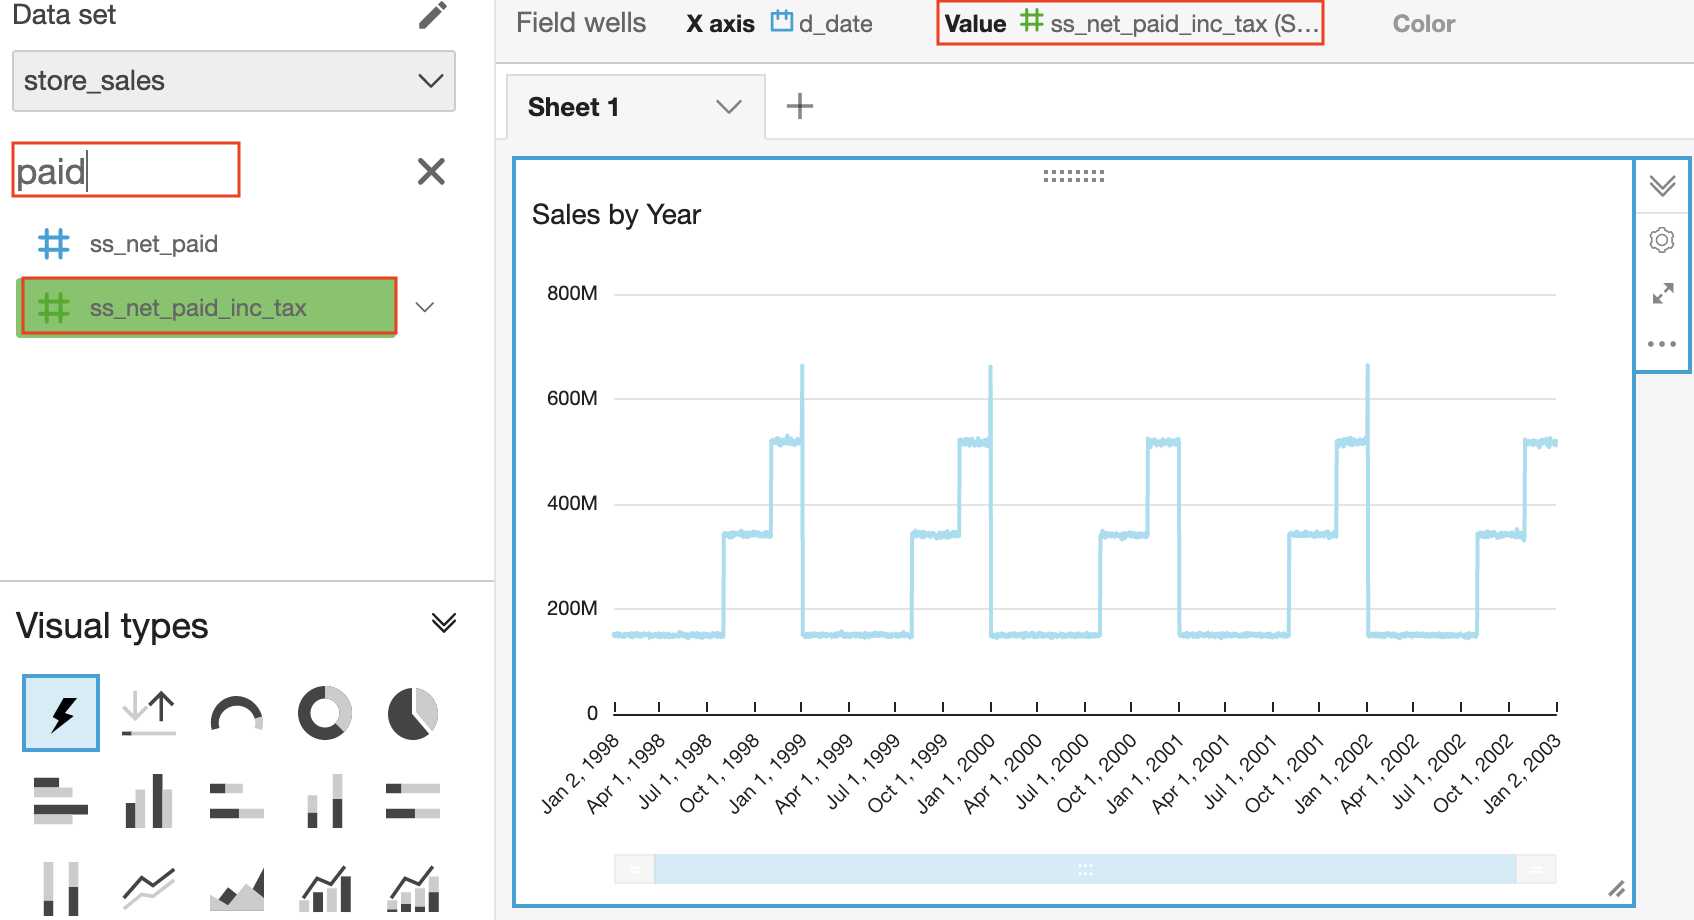 |
| Miguel notices that the chart is aggregated by the d_date field, but wants to see the data by quarter. | Click on the d_date field in the Field wells and change aggregation to Quarter. | 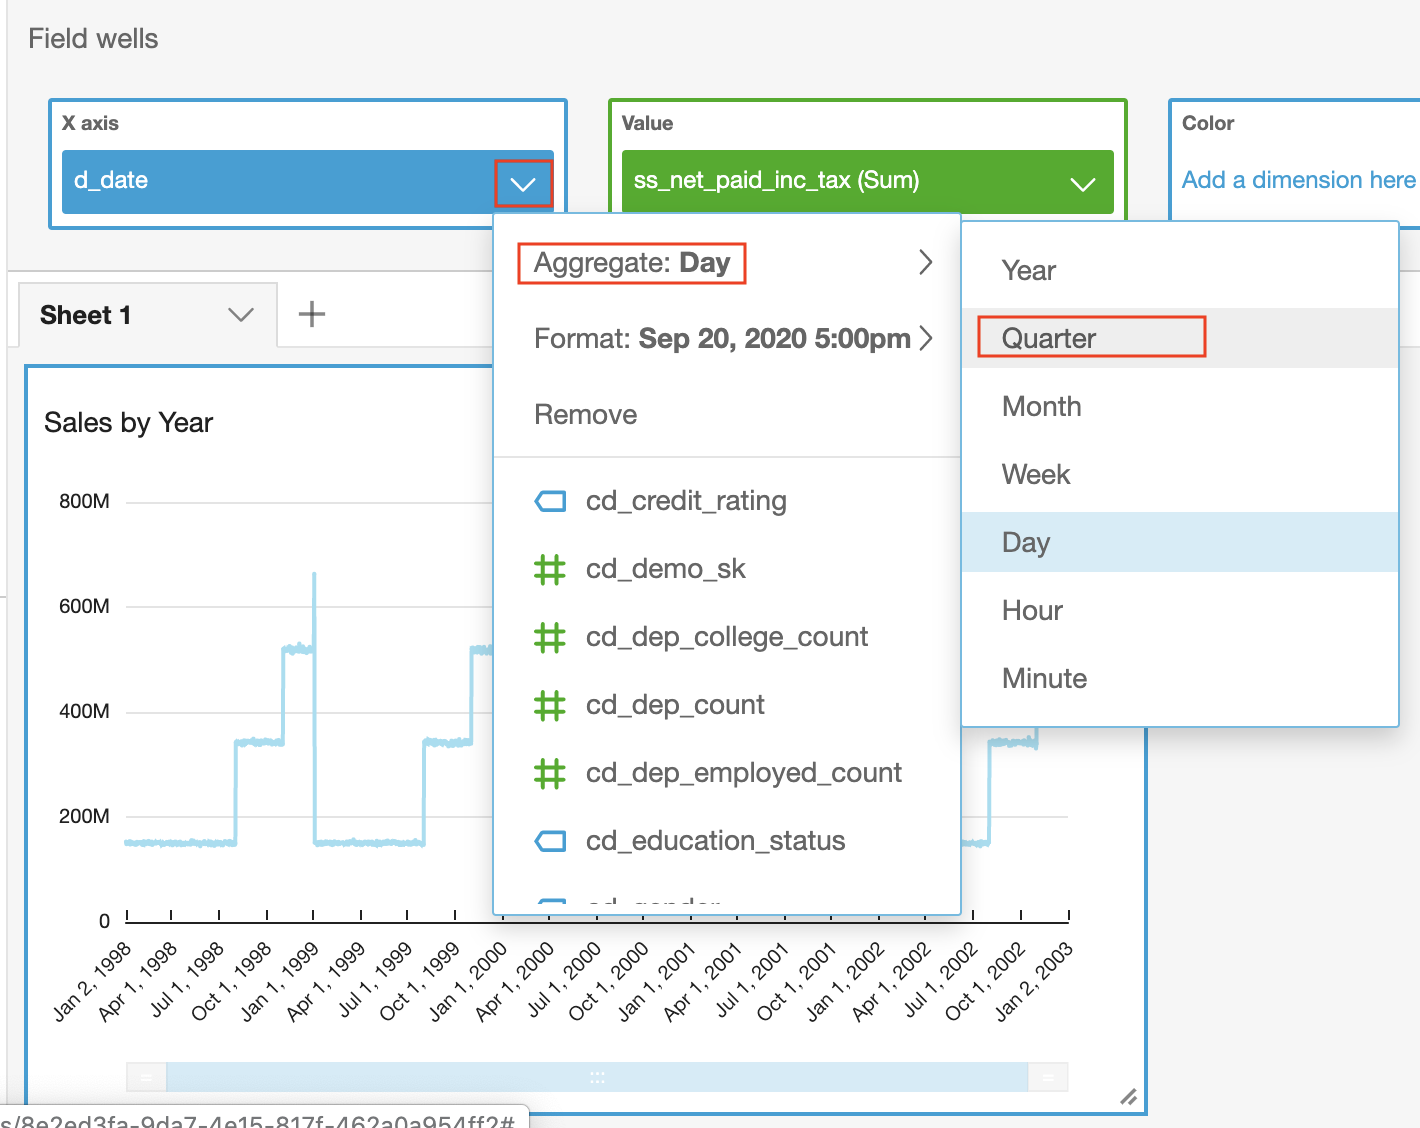 |
| Miguel also wants to add a forecast to this chart. | Click on the chart options, and click on the Add Forecast |  |
| Miguel wants to add an additional Analysis. | Click on the Add –> Add Visual button. |  |
| This time, Miguel wants to show the geographic distribution of sales. | Click on the Map visual type. | 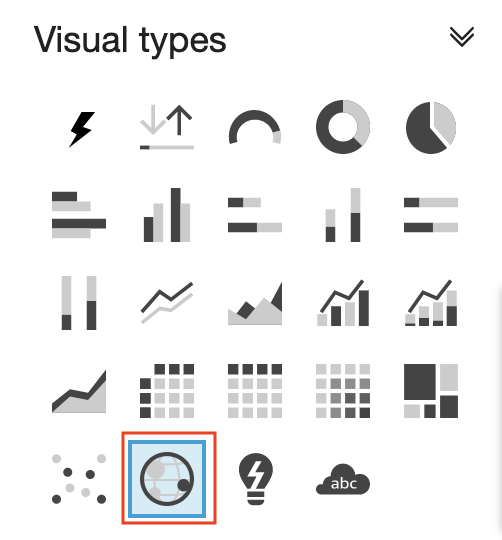 |
| Miguel wants to group the sales by store Zip Code | On the list of fields, enter into the search box the word zip and click on the s_zip field. | 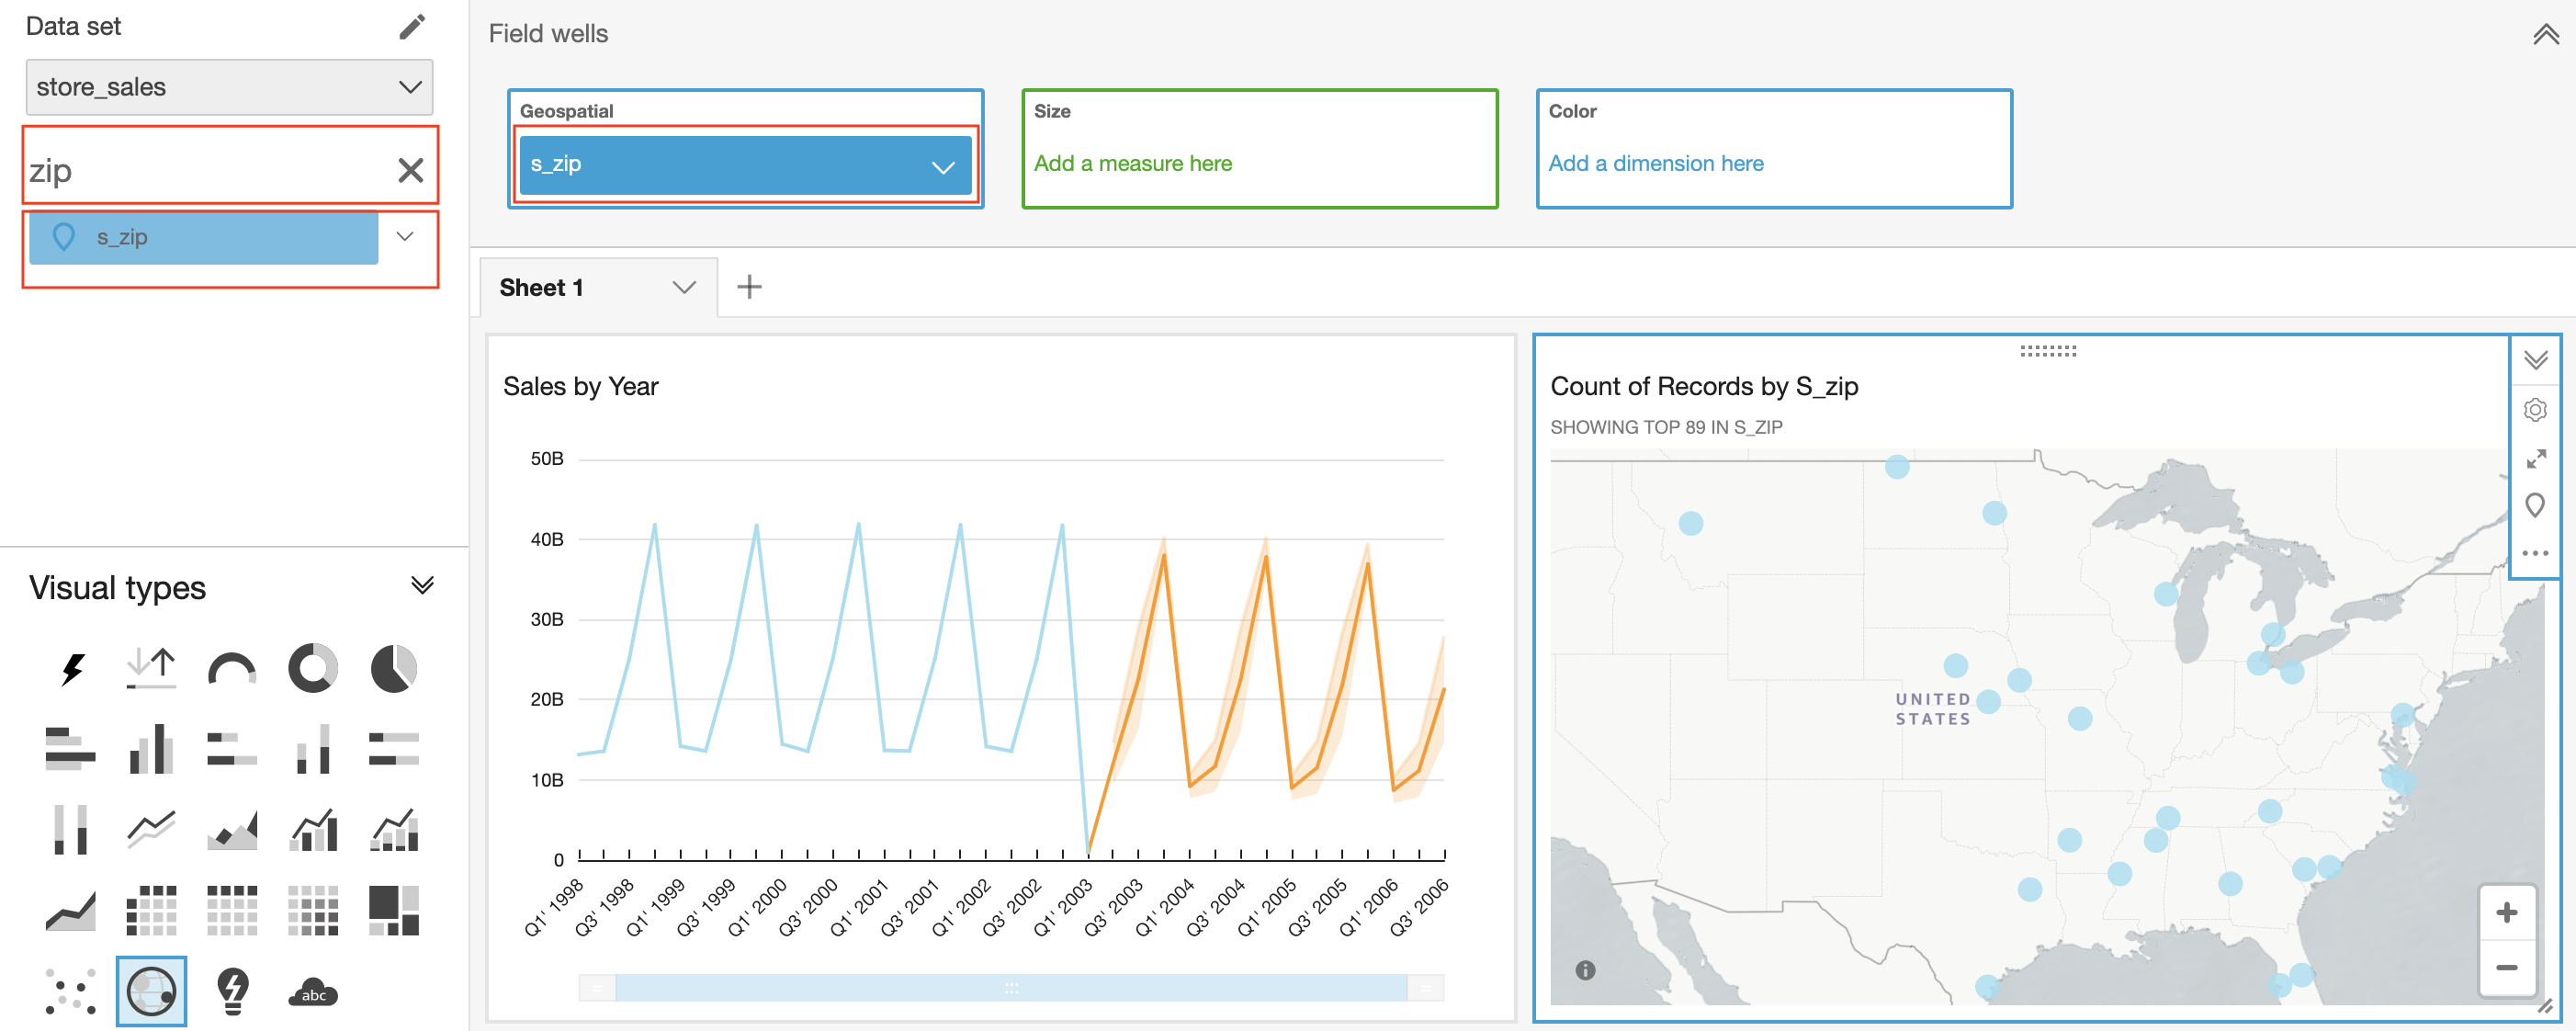 |
| Miguel again notices, the default behavior is a count by Zip Code, instead he wants to show ss_net_paid_inc_tax | On the list of fields, enter into the search box the word paid and click on the ss_net_paid_inc_tax field. | 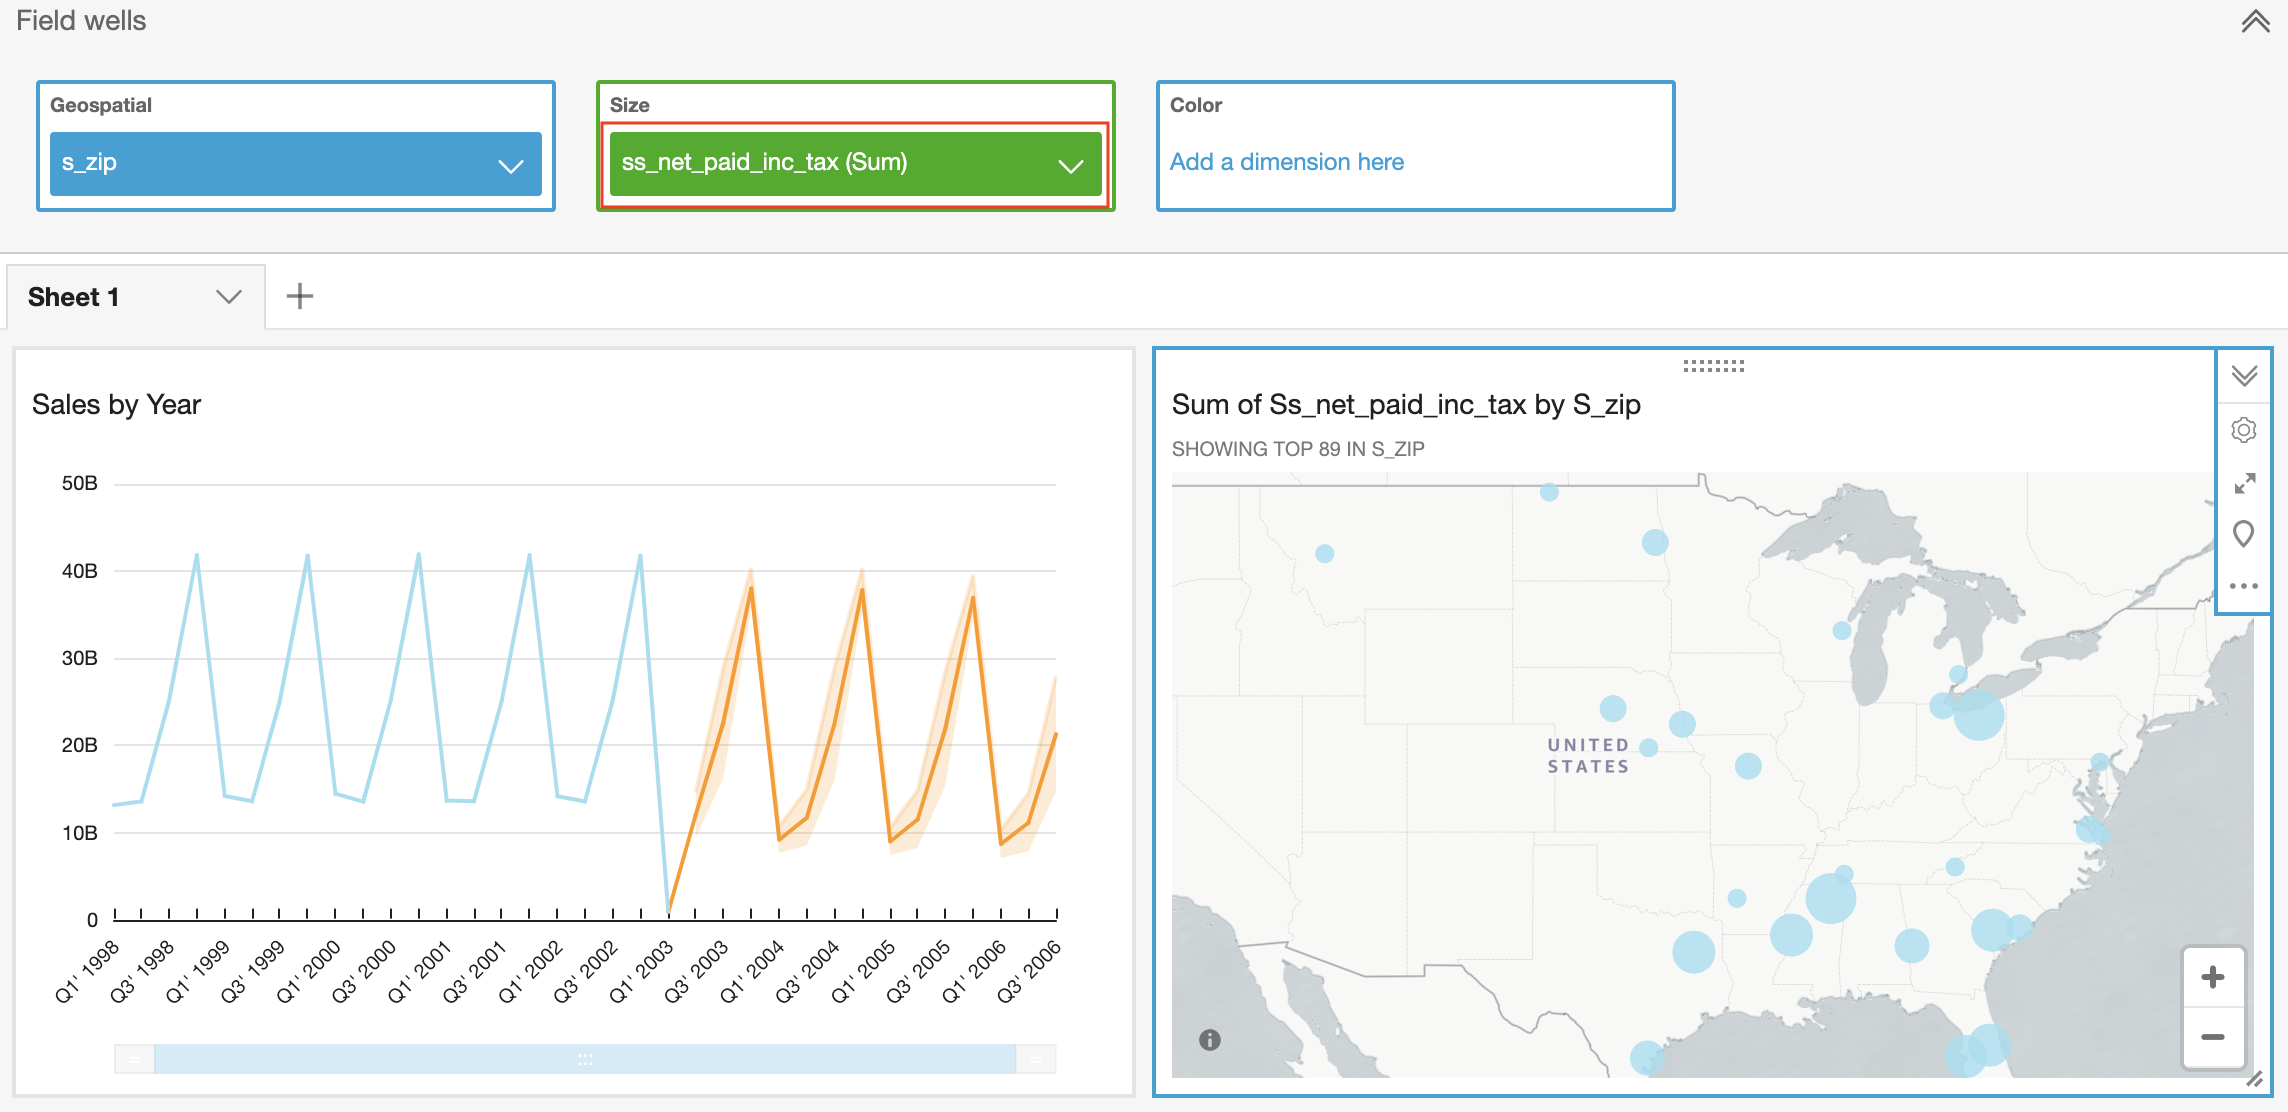 |
| Miguel also wants to break down the analysis by customer gender | On the list of fields, enter into the search box the word gender and click on the cd_gender field. |  |
| Now, Miguel wants to insert some textual insights. | On the left pane, click on the Insights section. Click the + next to the Highest Quarter insight. | 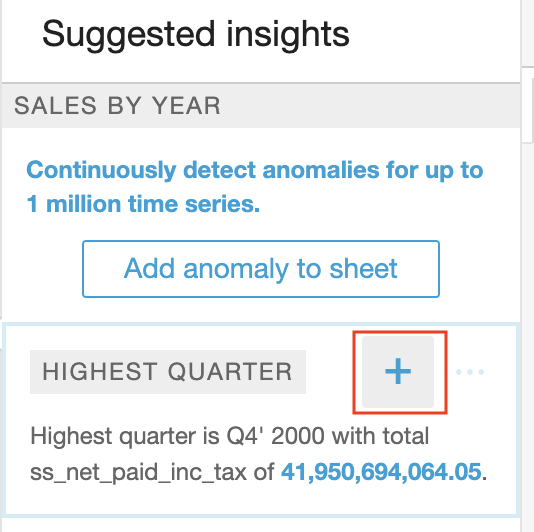 |
| Miguel wants insert a second insights. | On the left pane, click on the Insights section. Click the + next to the Quarter over Quarter insight. | 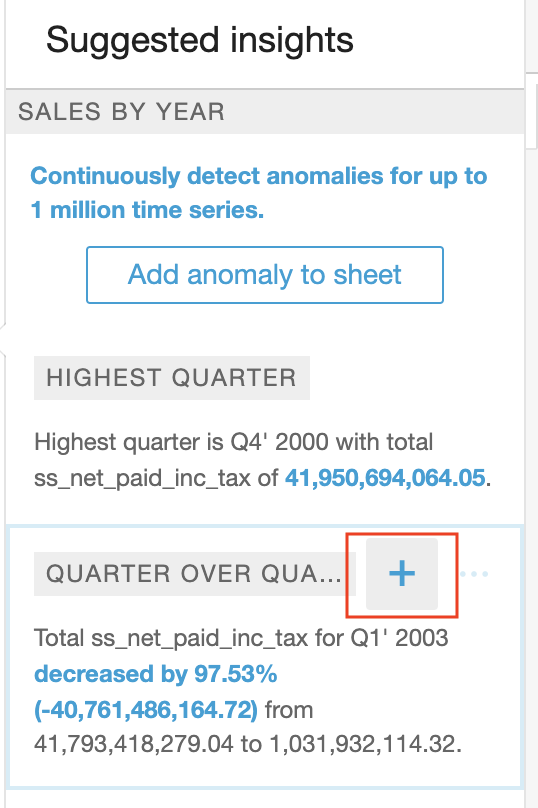 |
| Miguel wants to align the two insights above the map so he resizes them to fit. | Resize the two insights to fit above the line chart. Also extend the line chart to reach the bottom of the map. | 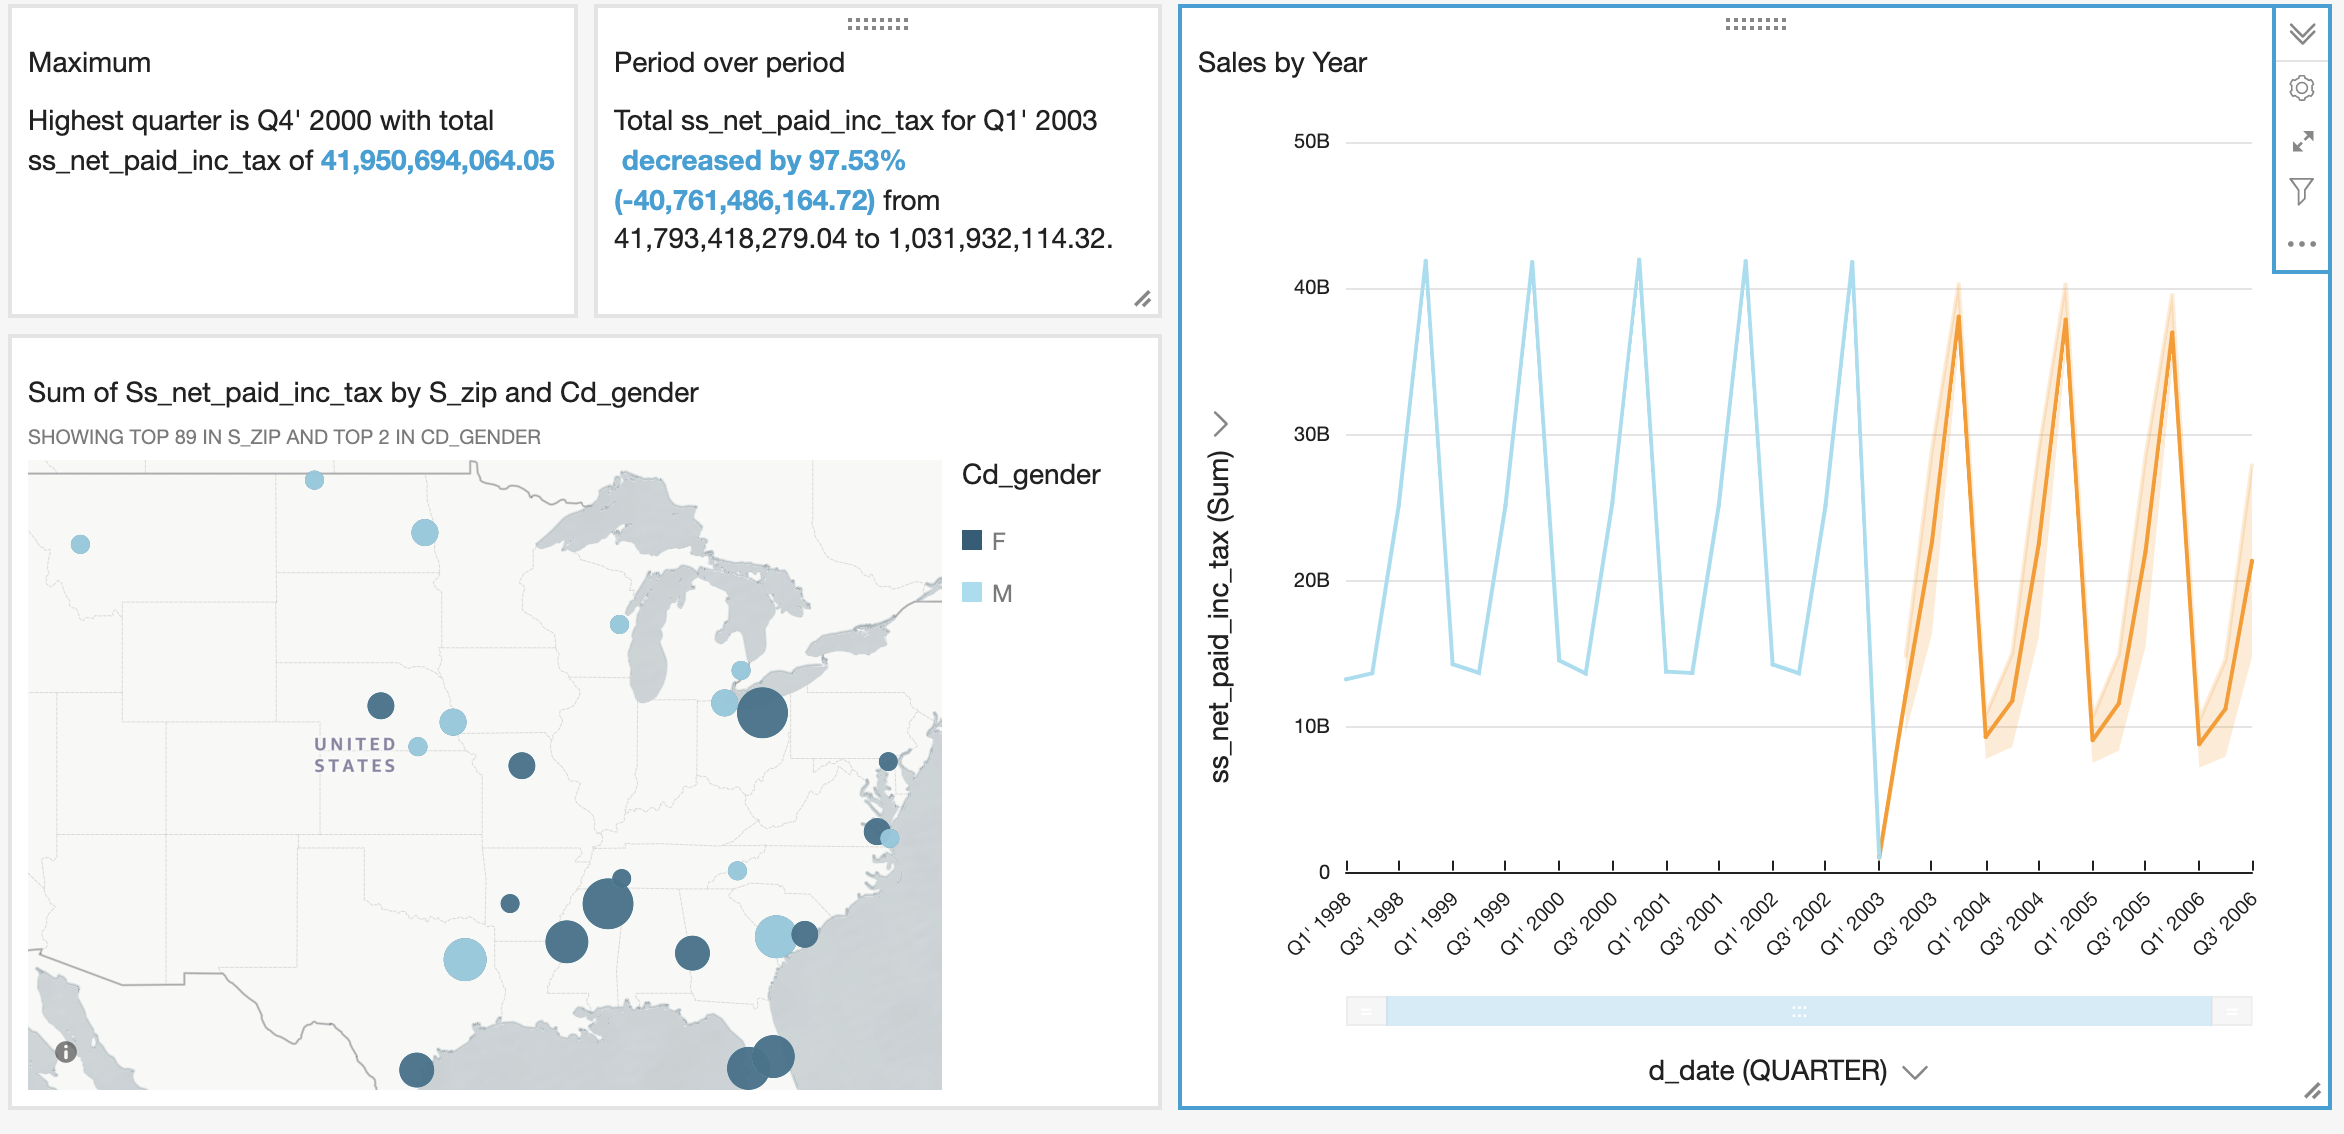 |
| Miguel wants to add a control to the dashboard, so users can narrow in on a Geographic area | On the left pane, click on Parameters and create a new parameter named State | 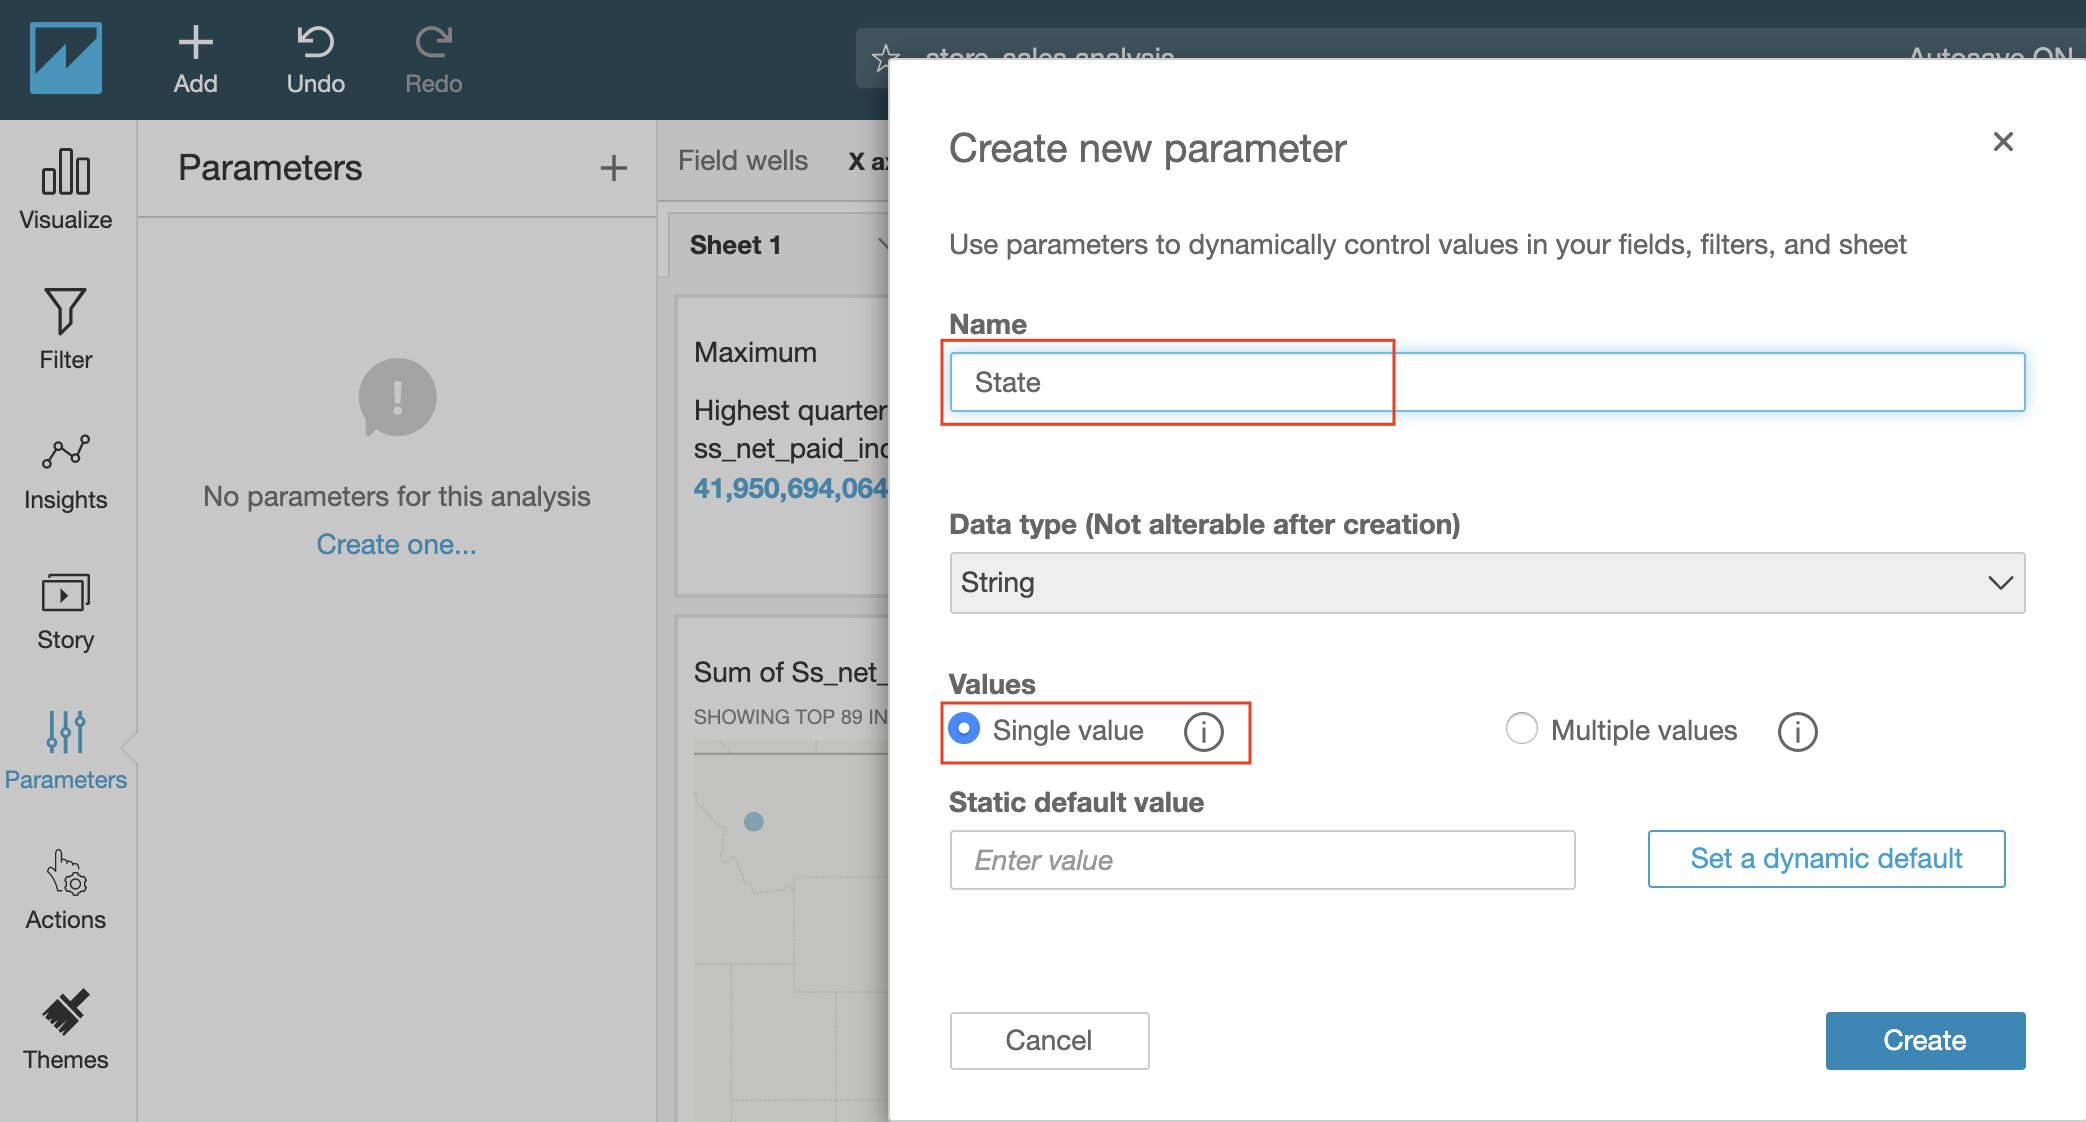 |
| Next, tie the parameter to a control | Click on Add Control | 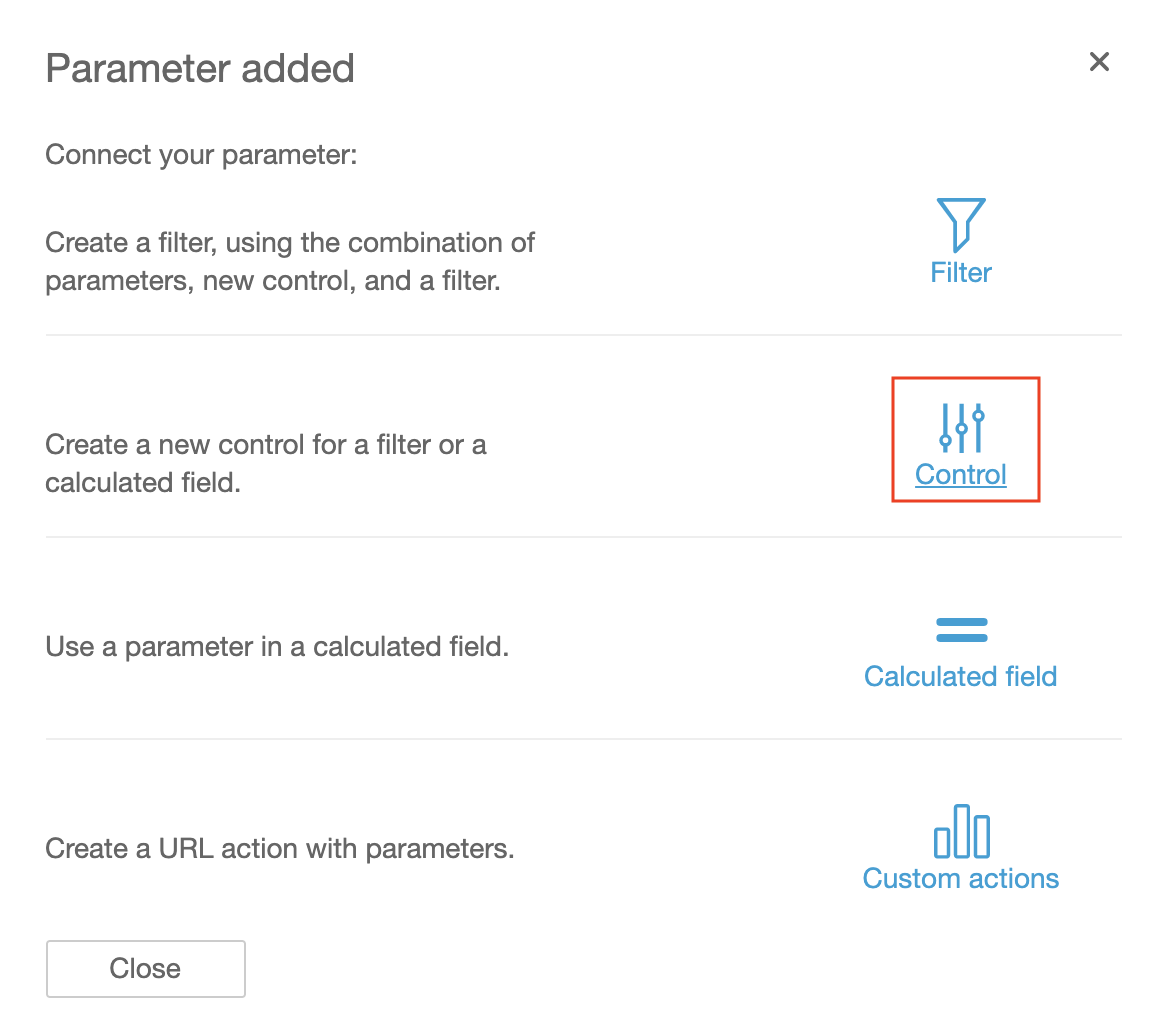 |
| Next, associate the control to a field in the data set. | Set the name of the control to State, the style to Single select drop down, the option to Link to a data set field, the data set to store_sales and the column to s_state. Click Add. | 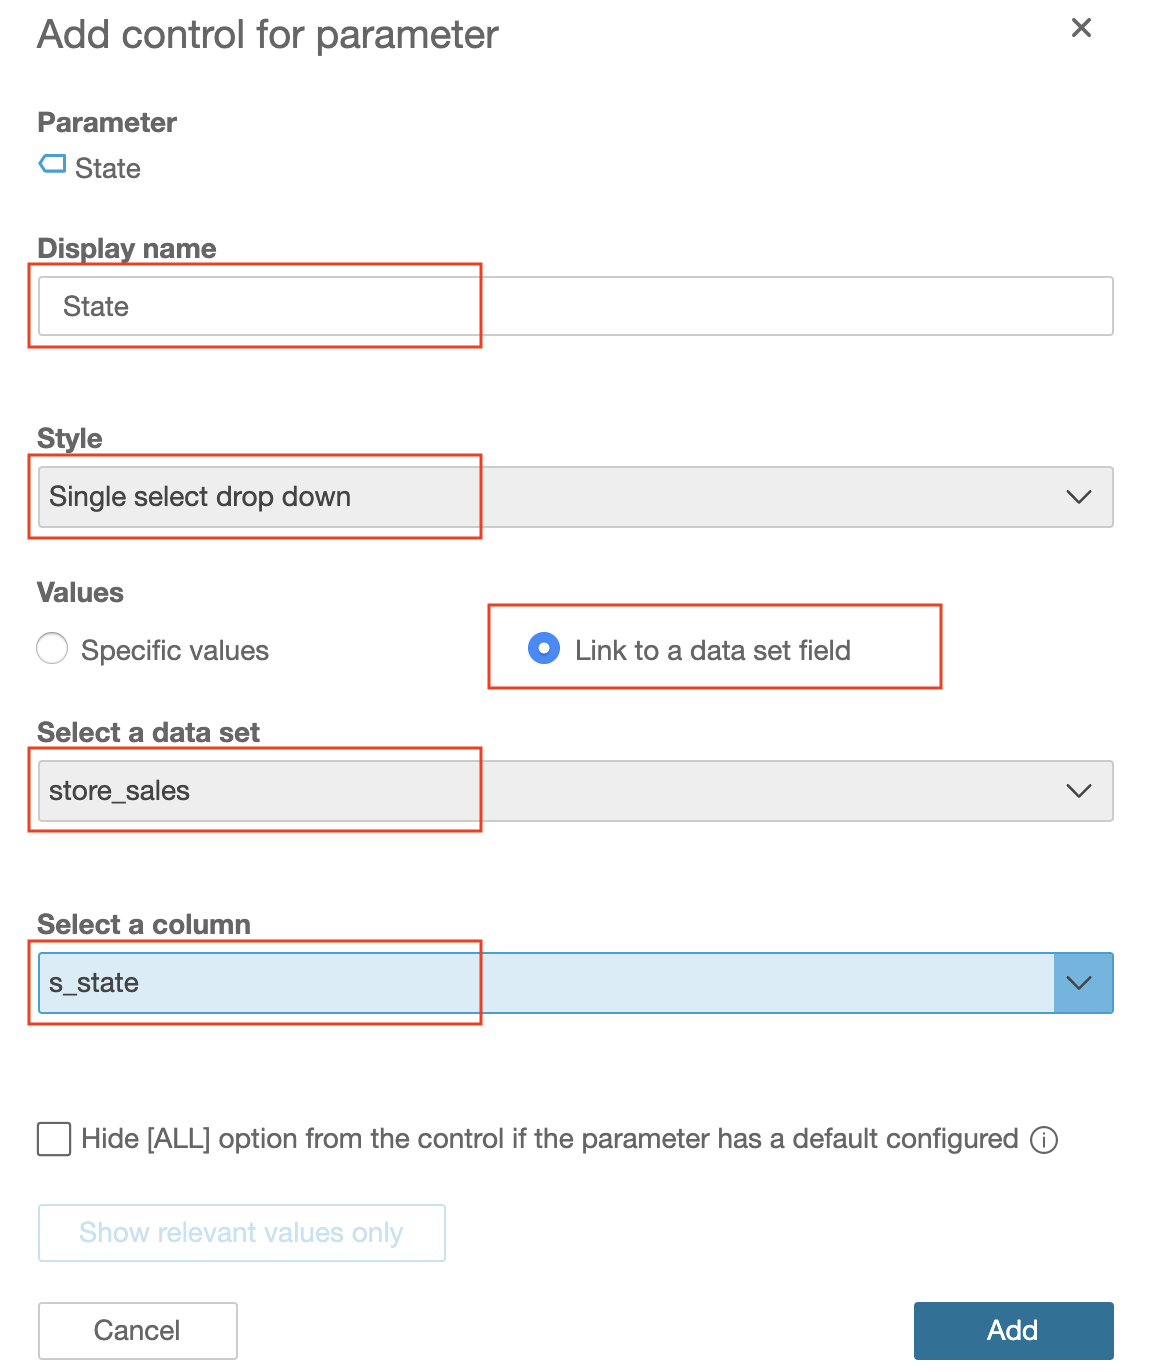 |
| To make this control affect the visuals, Miguel needs to tie it to a filter | Click on Filter from the left pane. Add a new filter which should affect All visuals. Choose the column s_state and the type Custom filter. Make the filter equals the parameter State. Click Apply. | 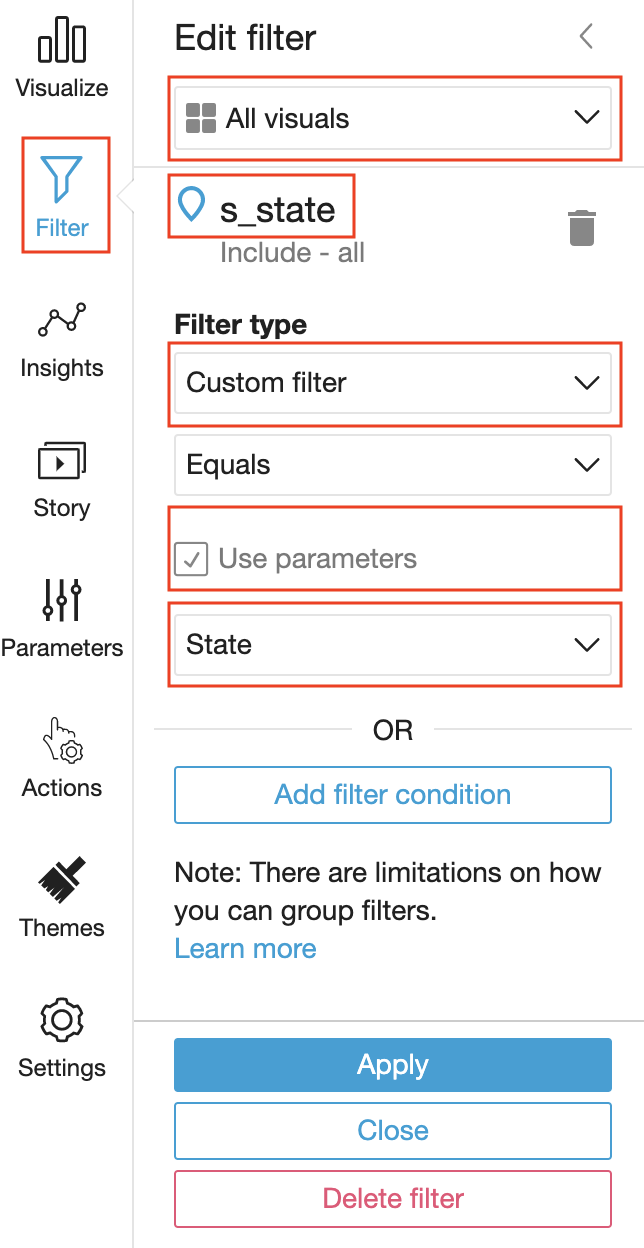 |
Share the Analysis
| Say | Do | Show |
|---|---|---|
| Now that the analysis is ready. Miguel wants to publish the dashboard. | Click on Share and Publish Dashboard |  |
| He needs to give the dashboard a name | Enter Sales Dashboard and click Publish dashboard | 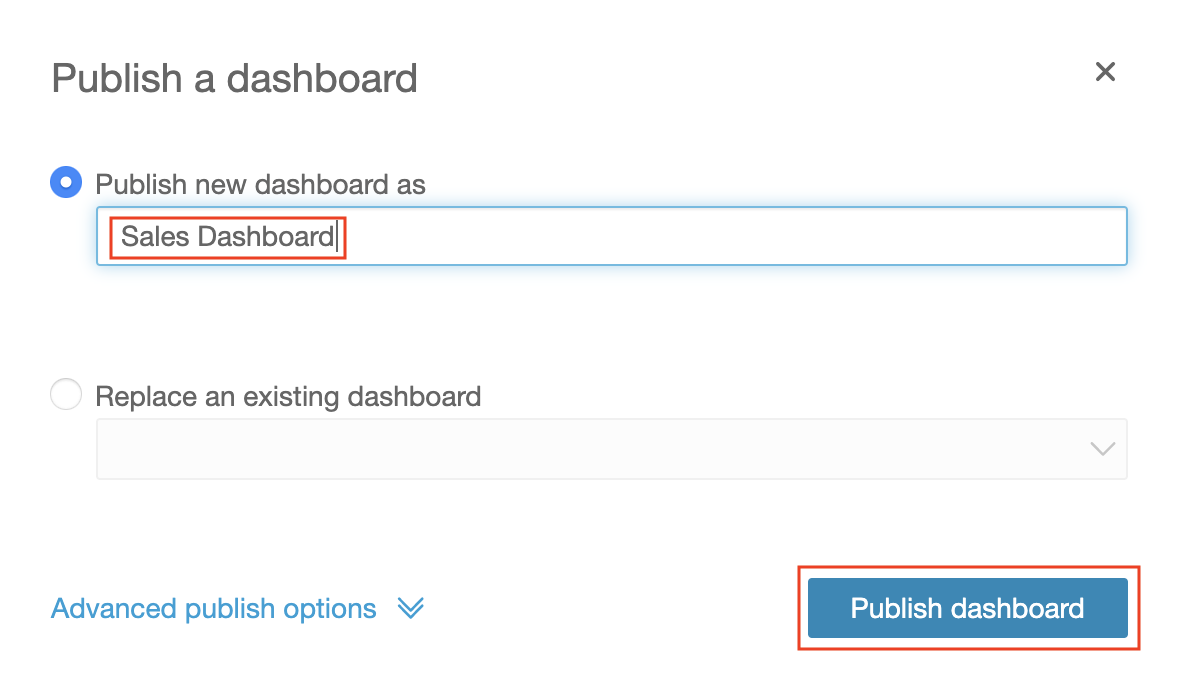 |
| Miguel has the option to choose who should get the Dashboard. He could choose all users, an individual user, or a group of users. | Skip this step by clicking on the X. | 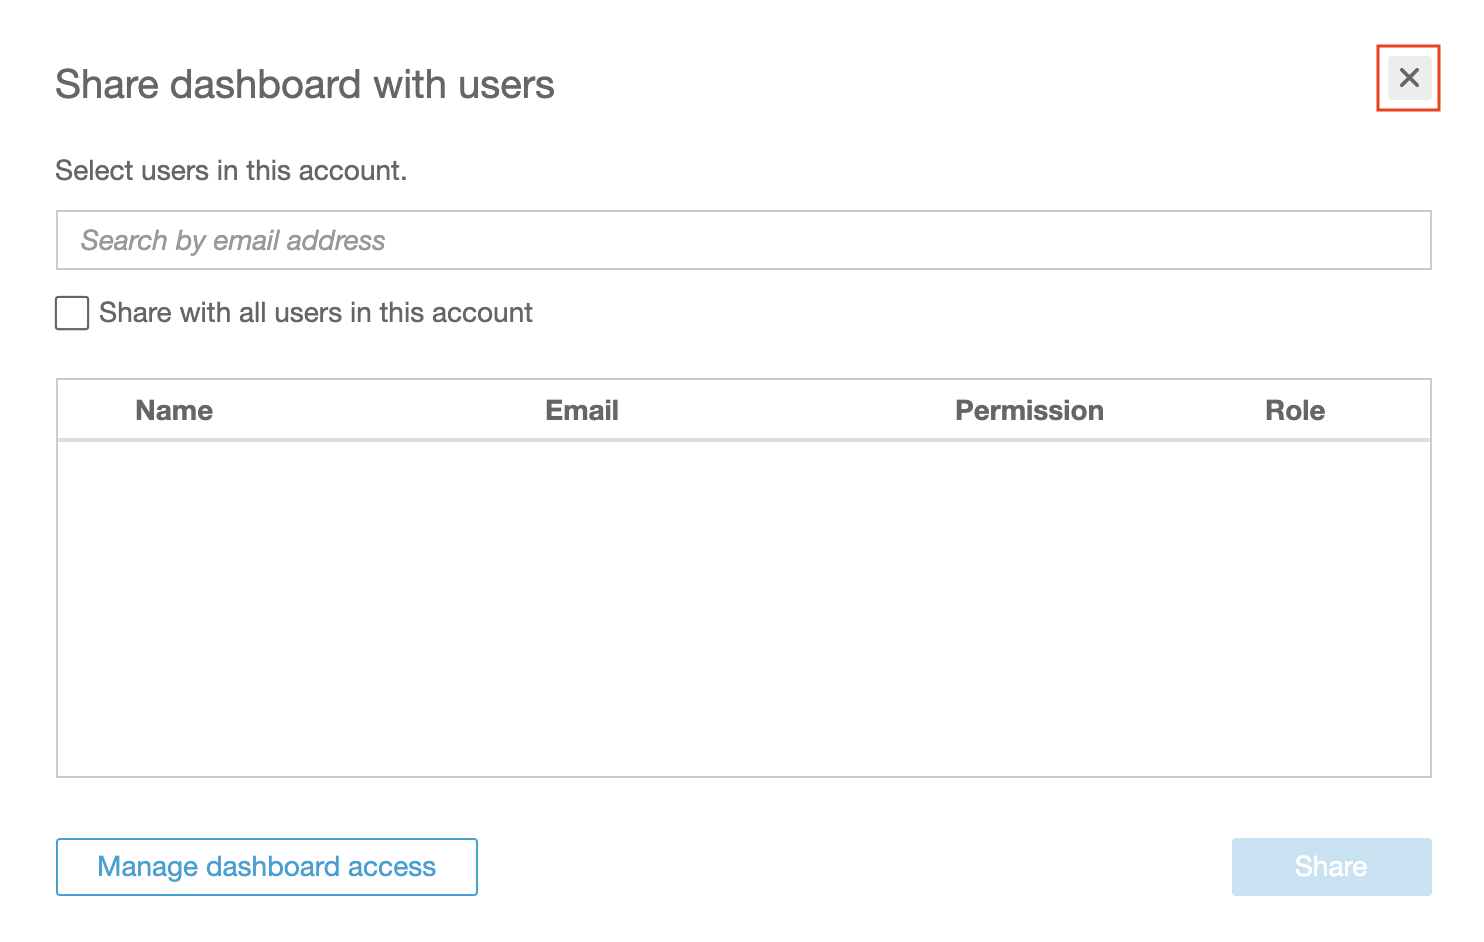 |
| Miguel is happy with the final product. | Show the dashboard. Highlight some metric values. |  |
| Miguel wants to test the control he added. | Click on the State control and change the value to LA | 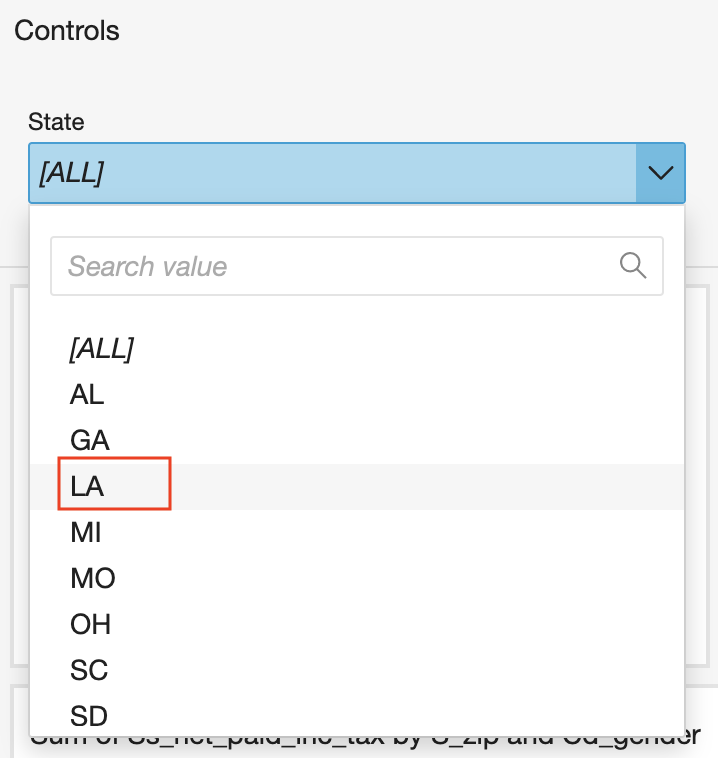 |
| Miguel can see that the control is working as expected, with each visual changing based on the new filter condition. | Highlight the new metric values and how they have changed. | 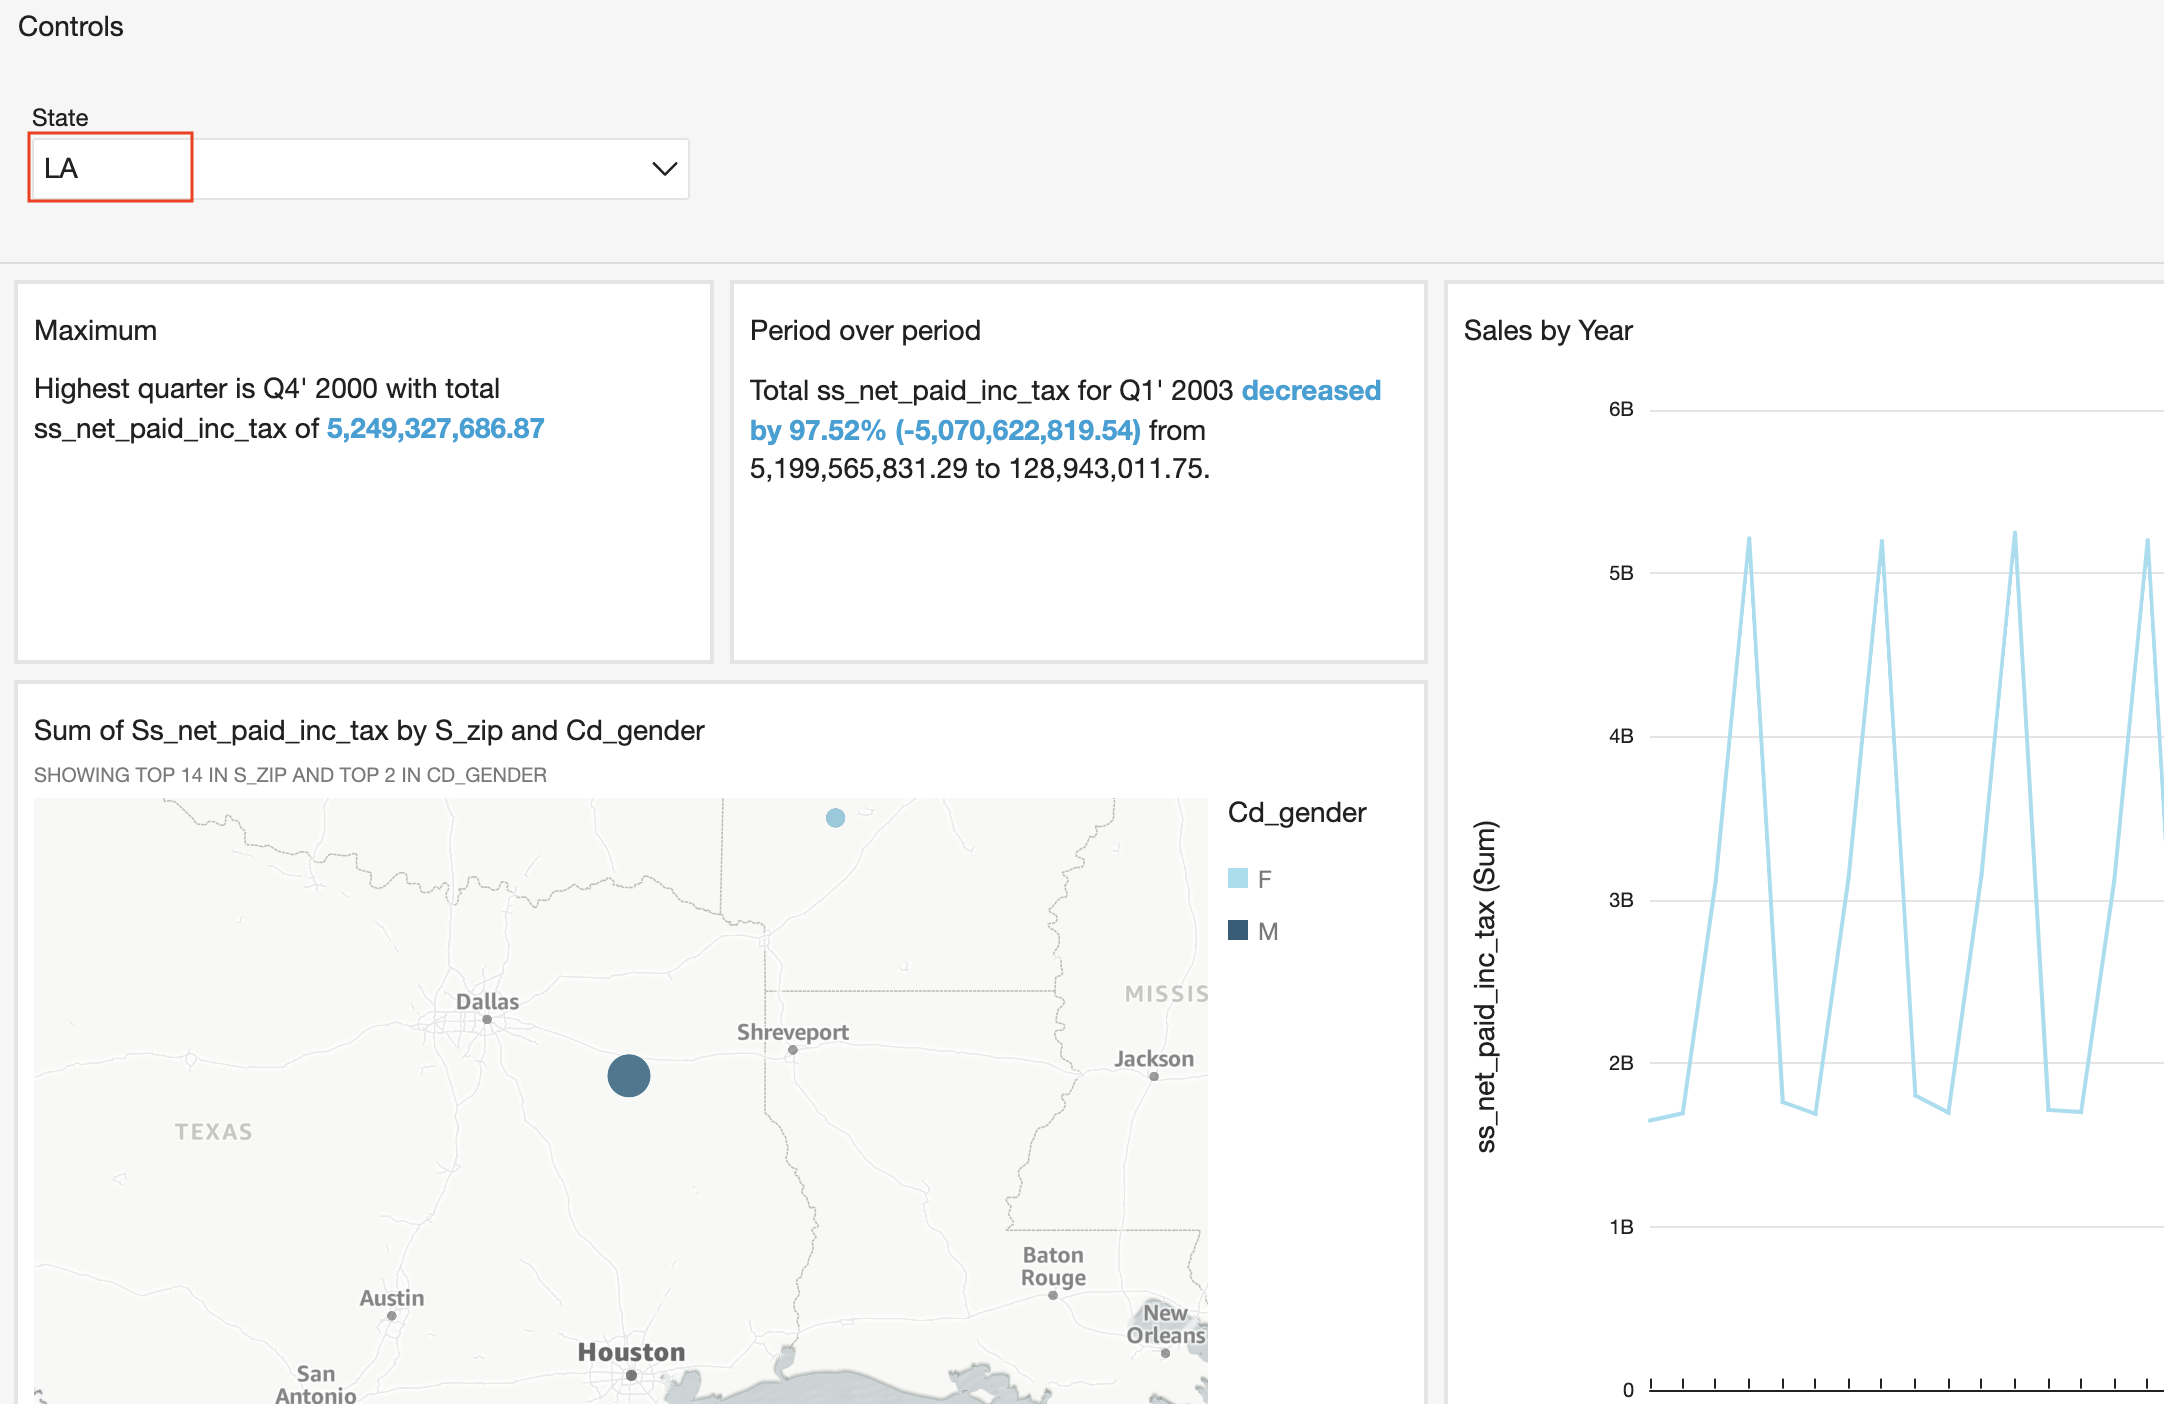 |
Inspect the Redshift Queries
| Say | Do | Show |
|---|---|---|
| As a last step, Miguel wants to inspect the Redshift queries to ensure they are joining the data correctly and using the correct filtering. | Navigate to the query list page: https://console.aws.amazon.com/redshiftv2/home?region=us-east-1#queries/. Ensure you have the right cluster selected from the drop-down list. Click on the query id of the last query on the list. |  |
| Miguel will inspect the last query and see the execution details of that query. | Note the execution time of the query. |  |
| Miguel will scroll down to see the full text of the SQL | Note the inner join clauses and the filter criteria. Also note that only columns used in the analysis are returned in the query. | 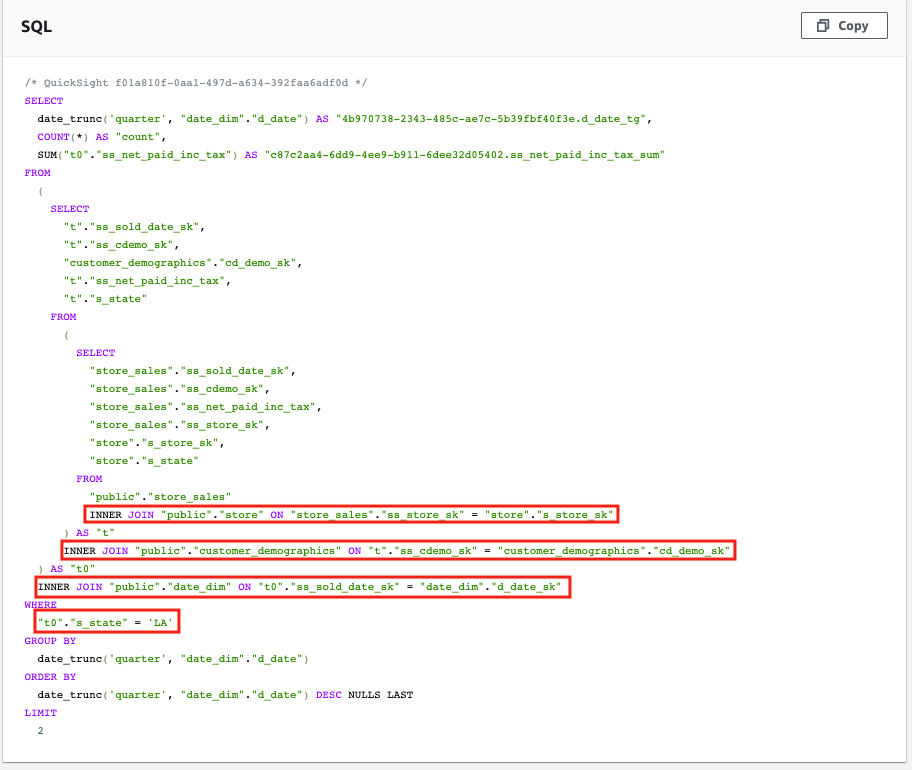 |
Before you Leave
To clear out any QuickSight changes you made during the demo, delete the Dashboard, Analysis & Data Set you created.
If you are done using your cluster, please think about deleting the CFN stack or to avoid having to pay for unused resources do these tasks:
- pause your Redshift Cluster
- stop the Oracle database
- stop the DMS task