Working with the Data Lake
Demo Video

Before you Begin
Capture the following parameters from the launched CloudFormation template as you will use them in the demo.
https://console.aws.amazon.com/cloudformation/home?region=us-east-1#/stacks?filteringText=&filteringStatus=active&viewNested=true&hideStacks=false
- GlueExternalDatabaseName
- TaskDataBucketName
Client Tool
The screenshots for this demo will leverage the SQL Client Tool of SQLWorkbench/J. Be sure to complete the SQL Client Tool setup before proceeding. Alternatives to the SQLWorkbench/J include:
- SageMaker: analyst.ipynb
- Redshift Query Editor
Challenge
Miguel has recently been tasked with solving a few different business problems with data related to their website traffic and purchasing behavior. He asked Marie how could he access the product review data. Marie recently added automated ingestion that loads product review and web analytics data into their new data lake in S3 and it is available in the Data Catalog. To solve this challenge Miguel will do the following:
- Sample the Data
- Connect the Data to Redshift
- Analyze the Data
- Extend the Data Warehouse with the Data Lake
Sample the Data
| Say | Do | Show |
|---|---|---|
| First, let’s take a look at the raw data in S3. You’ll notice that the data is first partitioned by product. | Navigate to: https://s3.console.aws.amazon.com/s3/buckets/amazon-reviews-pds/parquet/?region=us-east-1 |  |
| Next, let’s dive deeper and look at the Apparel category and see the files | Navigate to: https://s3.console.aws.amazon.com/s3/buckets/amazon-reviews-pds/parquet/product_category=Apparel?region=us-east-1 or just click on the product_category=Apparel folder |  |
| Prior to starting the demo today, this data was cataloged using a service called the Glue Data Crawler. Next, let’s take a look at the Glue Catalog and see some metadata about this table. | Navigate to the glue table list: https://console.aws.amazon.com/glue/home?region=us-east-1#catalog:tab=tables. Click on the table associated to <GlueExternalDatabaseName> database. |  |
| Inspecting the table metadata, we see some interesting things. | Highlight the SerDe of Parquet and the recordCount of 160Mil |  |
| Inspecting the table schema, we see the column data types and the partition columns. | Highlight that the product_category is set as the partition key. |  |
Connect the data to Redshift
| Say | Do | Show |
|---|---|---|
|
Let’s now connect our Redshift Cluster to this External Database for querying.
Replace the value for <GlueExternalDatabaseName> with the value previously determined. Amazon Redshift now supports attaching the default IAM role. If you have enabled the default IAM role in your cluster, you can use the default IAM role as follows. Follow the blog for details. |
Execute the following command:
|

|
| Let’s do a quick check to confirm we can access the data. Note, the 160+ million records matches the number the Glue Crawler showed. |
Execute the following: |

|
Analyze the Data
| Say | Do | Show |
|---|---|---|
| Looks interesting! Now Miguel wants to aggregate the reviews data by product, number of reviews and their average rating. In order to use this data in future queries, we’ll create a view named product_reviews_agg. |
Execute the following:
|

|
| Now, Let’s find the most reviewed products in the Home and Grocery categories using the view we just created. |
Execute the following:
|

|
| Miguel has quickly found that the product “San Francisco Bay One Cup Coffee” is the most reviewed product. Let’s look at it further to try and understand how this product is perceived over time by the customers that actually purchased it. Let’s look at the 30 and 90 day rolling averages to look for trends… |
Execute the following:
|

|
Extend the Data Warehouse with the Data Lake
| Say | Do | Show |
|---|---|---|
| After looking at the review trends for the SF Bay Coffee product, Miguel, wants to gain further insight into the customers across all the product categories. He also wants to leverage the existing customer demographic information in Redshift to augment the data. To support his reporting audience, Miguel will place the combined data set into a new Redshift table. |
Execute the following which will combine the loaded customer data with the reviews into a new table:
|

|
|
The result are very useful! Miguel wants to export the result back to Data lake to share it with other teams. He can easily unload data from Redshift to the Data Lake, so other tools can process the data when needed. Note: UNLOAD supports dynamic partitioning and parquet format. By selecting a partition column we can optimize the output for query performance.
Replace the value for <TaskDataBucketName> with the value previously determined. Amazon Redshift now supports attaching the default IAM role. If you have enabled the default IAM role in your cluster, you can use the default IAM role as follows. Follow the blog for details. |
Execute the following which will export the combined table to a new S3 location:
|

|
|
Let’s check the exported data on S3
Replace the value for <TaskDataBucketName> with the value previously determined. |
Navigate to the S3:
|

|
Before you Leave
Execute the following to clear out any changes you made during the demo.
DROP VIEW   public.product_reviews_agg;
DROP TABLE  public.customer_trends;
DROP SCHEMA demo;
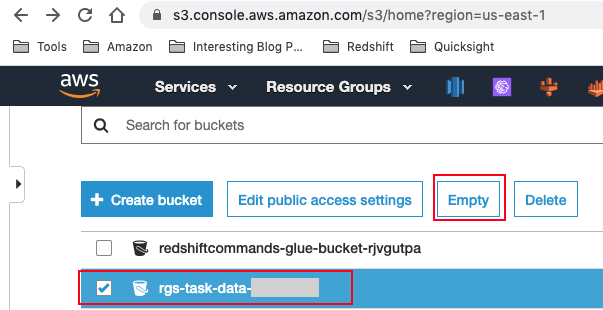
Navigate to S3 and empty your <TaskDataBucketName> bucket.

If you are done using your cluster, please think about deleting the CFN stack or to avoid having to pay for unused resources do these tasks:
- pause your Redshift Cluster
- stop the Oracle database
- stop the DMS task