Self-Service analytics using Serverless
Demo Video
Coming Soon!
Do this before the customer meeting. Plan atleast 1 hour to complete these steps
Follow the below setup steps in US East (N. Virginia) region aka us-east-1.
Amazon Quicksight Enterprise or Enterprise + Q edition is needed for this demo. If you are first time Quicksight user, follow the steps here to sign up for Quicksight Enterprise edition. If you have used Quicksight before, you only need to follow step #1.1 to validate that you have Enterprise edition. > If you are a first time user, you would land on setup screen as shown below, click Sign up for Quicksight and follow through the next steps > If you have used Quicksight in your account before, you would have are already signed up. You would land on the Quicksight home page. To Verify that you have Enterprise version, click on the profile icon on top right and click Manage Quicksight. On the Top left corner, if you see Standard, upgrade to Enterprise. If you see Enetrprise or Enterprise + Q, you are all set. You need not setup Quicksight. You can go back and go on to Step 2 to launch CloudFormation stack.Step1: Signup for/validate Amazon Quicksight Enterprise edition Click here to expand/collapse steps
Step
1.1. Navigate to Amazon Quicksight

1.2. Choose Enterprise edition and click Next
1.3. In the Account Info section, enter a unique name of your choice for Quicksight account name and enter your email ID. Leave defaults for all other options and click Create Account. Your Quicksight setup is compelte. 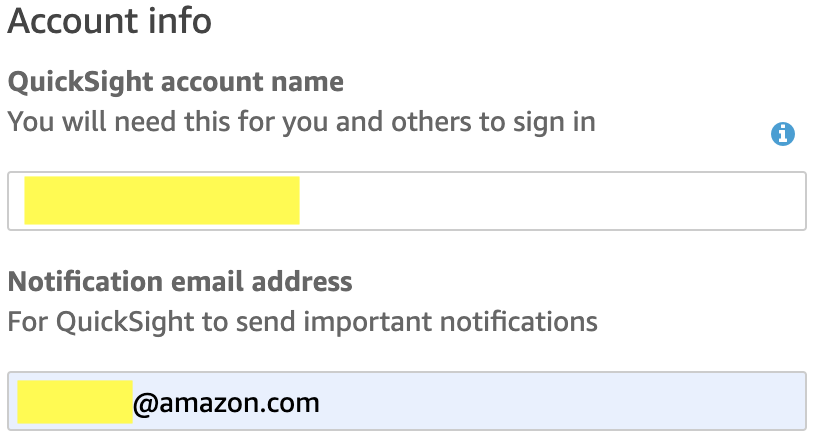
Click on the launch button below to setup your demo environment using the attached CloudFormation template. This stack takes approximately 30-40 minutes to deploy. Follow the instructions given below as you follow through the screens.Step2: Launch demo environment using CloudFormation template Click here to expand/collapse steps

| Step |
|---|
2.1. For Quicksight User, enter the Federated user name from your Isengard account. It will most likely be Admin/«your alias»-Isengard 
|
| 2.2. In Configure stack options page, Click Next |
| 2.3. Acknowledge to allow AWS CloudFormation to create IAM resources with custom names and Click Create Stack |
| 2.4. Wait for 30-40 minutes |
| 2.5. Once the stack creation is complete, Go to Stacks |
| 2.6. Click on the Stack you just deployed |
2.7. Navigate to Outputs tab and click on link next to MwaaApacheAirflowUI output 
|
2.8. In the DAGs tab, look for DAG named media_and_ent_demo_initial_setup. In the actions column, click on the Play button Icon and Click Trigger DAG. This DAG will execute for ~2 minutes 
|
Once setup steps are compete, read through the commentary below to understand how to conduct the demo.
Demo Architecture
AWS Servies used: Amazon Redshift Serverless, Amazon Quicksight, Amazon Managed Workflows for Apache Airflow(MWAA), Amazon S3, AWS Glue, AWS Lambda, AWS Identity and Access Management (IAM), AWS CloudFormation

In this demo, we will use Managed Workflows for Apache Airflow (MWAA) to trigger execution of an Ingest and Curate workload in Amazon Redshift Serverless on a 480GB viewership dataset with ~2.75 billion rows. The execution will take approximately 7 minutes. Then, we will use an Amazon Quicksight dashboard to visualize the data sets. Ingest, curate and reporting workloads are completely isolated from each other and executed on three separate Amazon Redshift Serverless workgroups. Data shares are setup between the workgroups, so that they work on the same underlying dataset.
Demo Steps
- Provide overview of sample data in S3 and Glue Catalog, if necessary
- Show Quicksight dashboard as having no data
- Execute an Airflow DAG to trigger Ingest and Curate workload(This execution takes ~7 minutes)
- Return to presentation deck and come back after presenting slide 25
- Show Quicksight dashboard with data and cost of your execution
- Clean up data after your customer meeting so that you are ready for the next meeting with a clean slate
Demo Script
Overview of data in AWS Glue catalog
| Say | Do | Show |
|---|---|---|
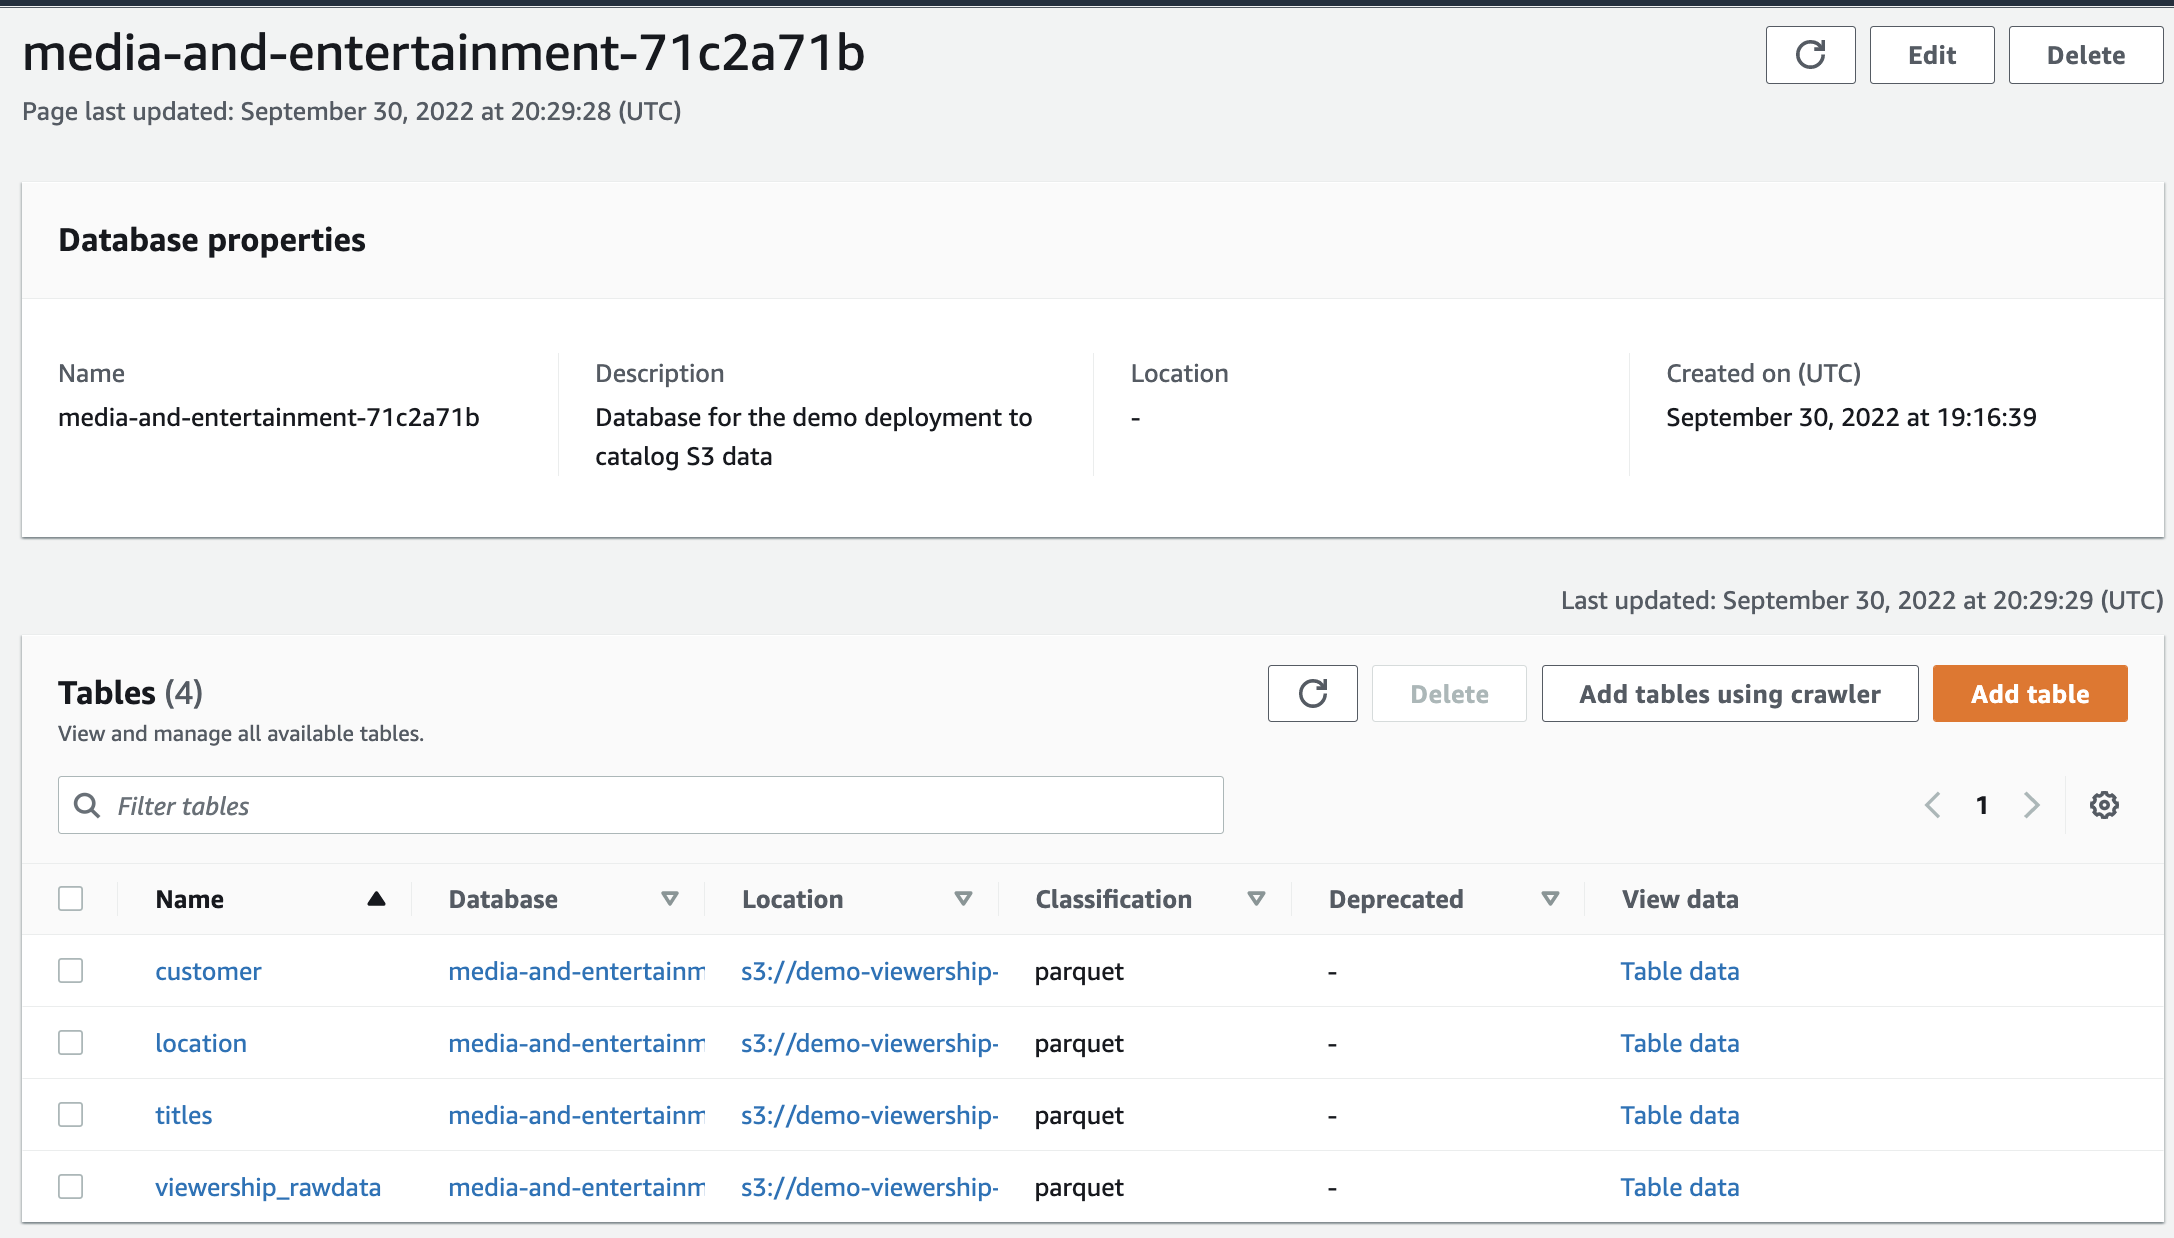
| Let’s take a look at the data used for demo. We cataloged the data using AWS Glue catalog. You can see the tables here. This sample dataset contains data for 200 million content viewing customers across 12 years. viewership-raw has data for each customer view such as customer id, number of seconds watched, is a trailer played, which device was used etc. Customer has customer’s demographic information such as age, gender etc. Location has information such as zipcodes, state, country etc. Titles has information about content such as name, director, lead actor, genre etc. You’ll notice that the viewership rawdata is first partitioned by year and then by month. |
|

|
Show Quicksight dashboard having no data
| Say | Do | Show |
|---|---|---|
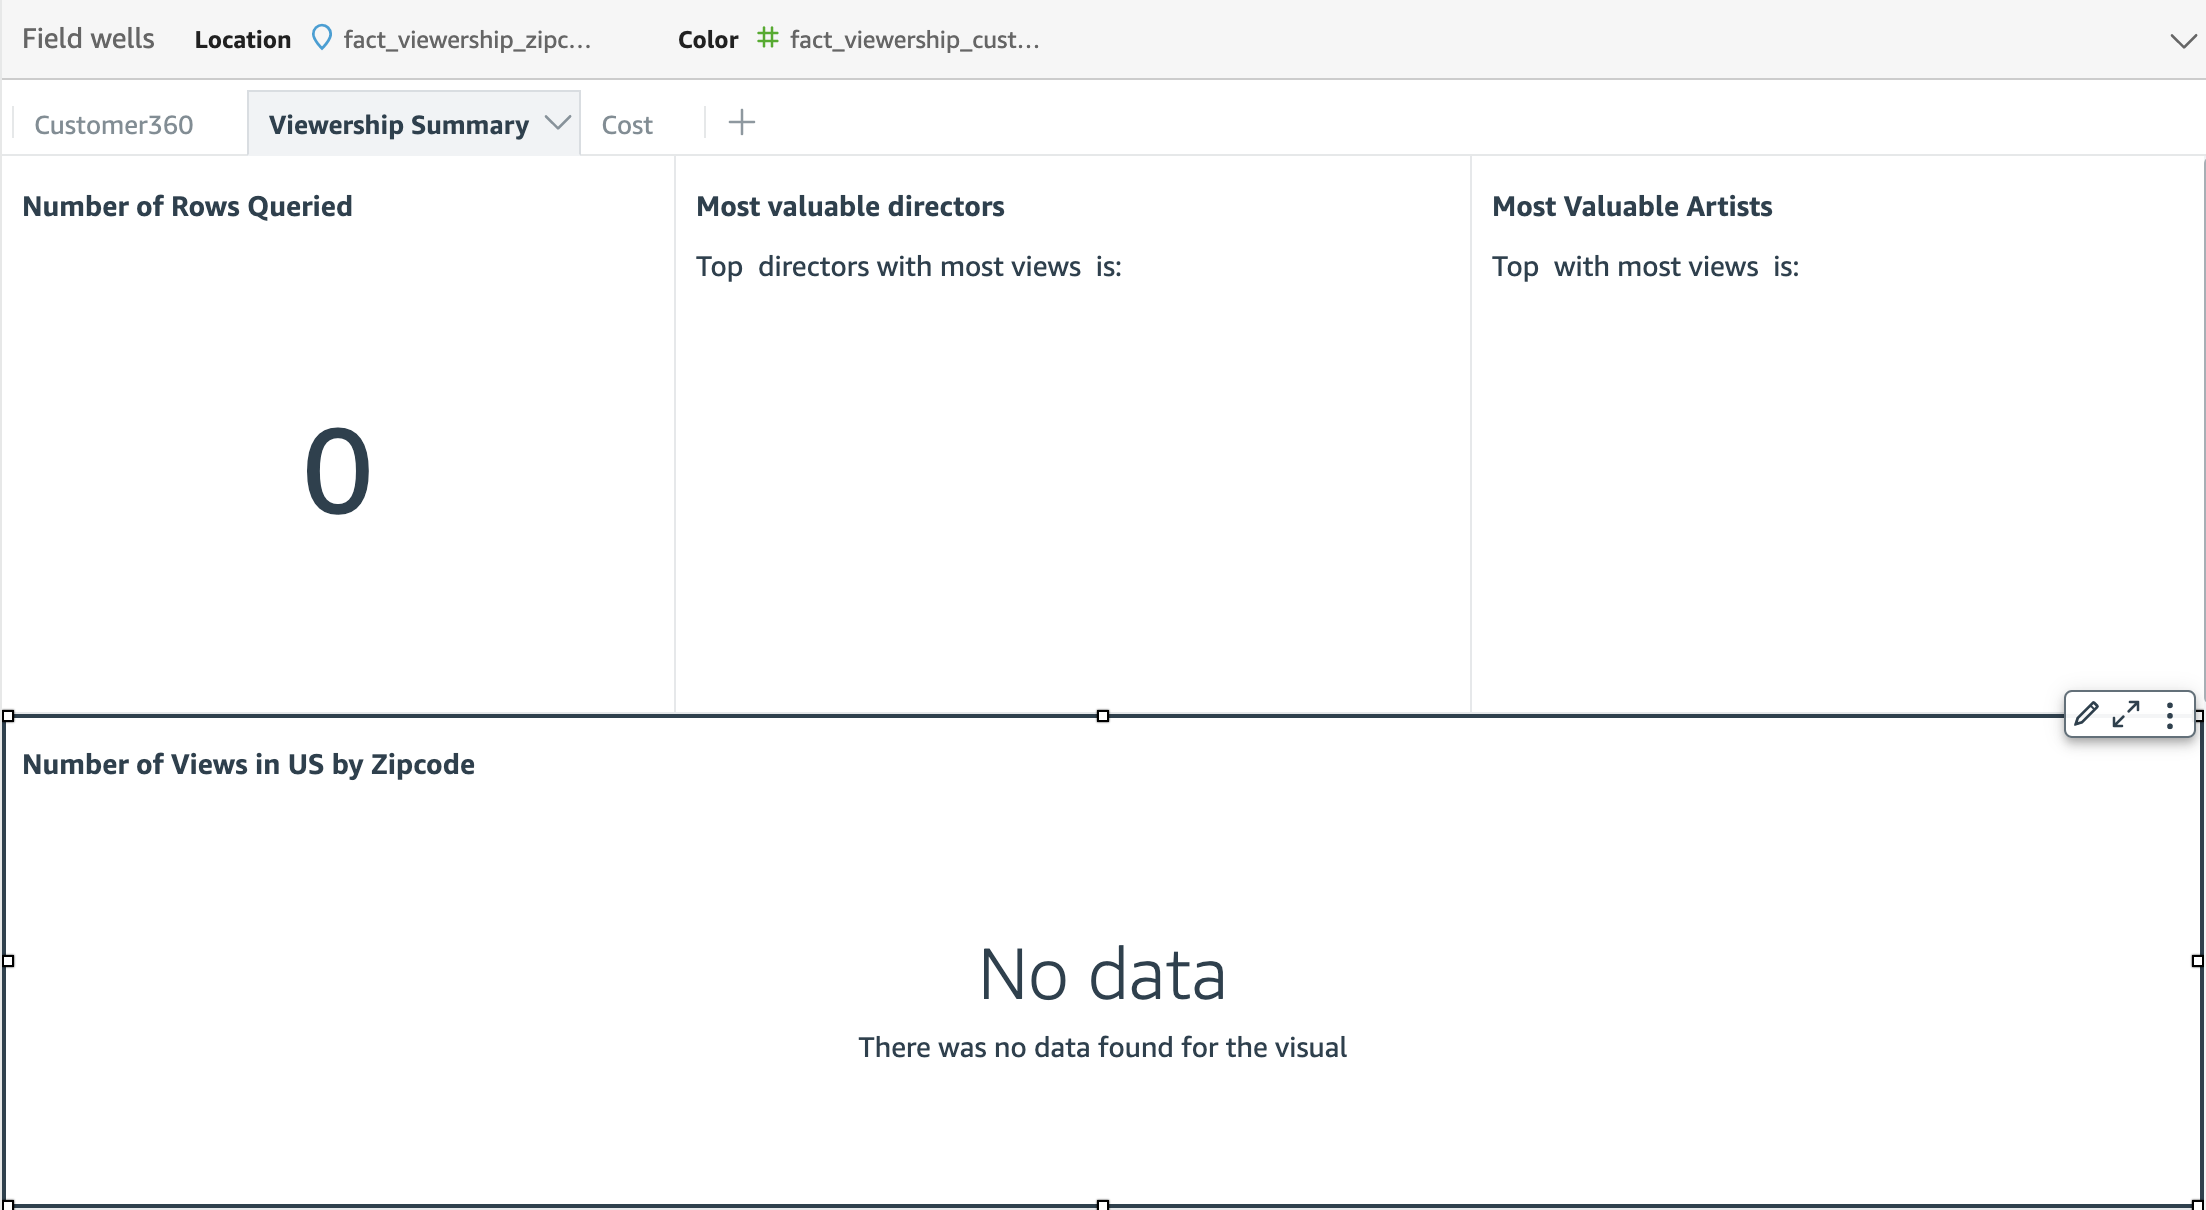
| Before we start Ingesting and curating this data, lets take a look at the Quicksight dashboard that will be used for visualization. As you can see there is no data here. Once the load is complete, you will see this dashboard populated. |
Navigate to Amazon Quicksight Dashboard |

|
Execute Airflow DAG
| Say | Do | Show |
|---|---|---|
| Now, we will use Managed Workflows for Apache Airflow(MWAA), our managed orchestration service for open source Airflow to run the Ingest and Curate workloads |
Navigate to the link captured in CloudFormation output MwaaApacheAirflowUI In the DAGs tab, under Actions column for the Dag media_and_ent_dataset_ingest_curate click on the PlayButton Icon and Click Trigger DAG This DAG will execute for ~7 minutes |

|
Return to presentation deck and come back after presenting slide 25
Show Quicksight dashboard with data
| Say | Do | Show |
|---|---|---|
|
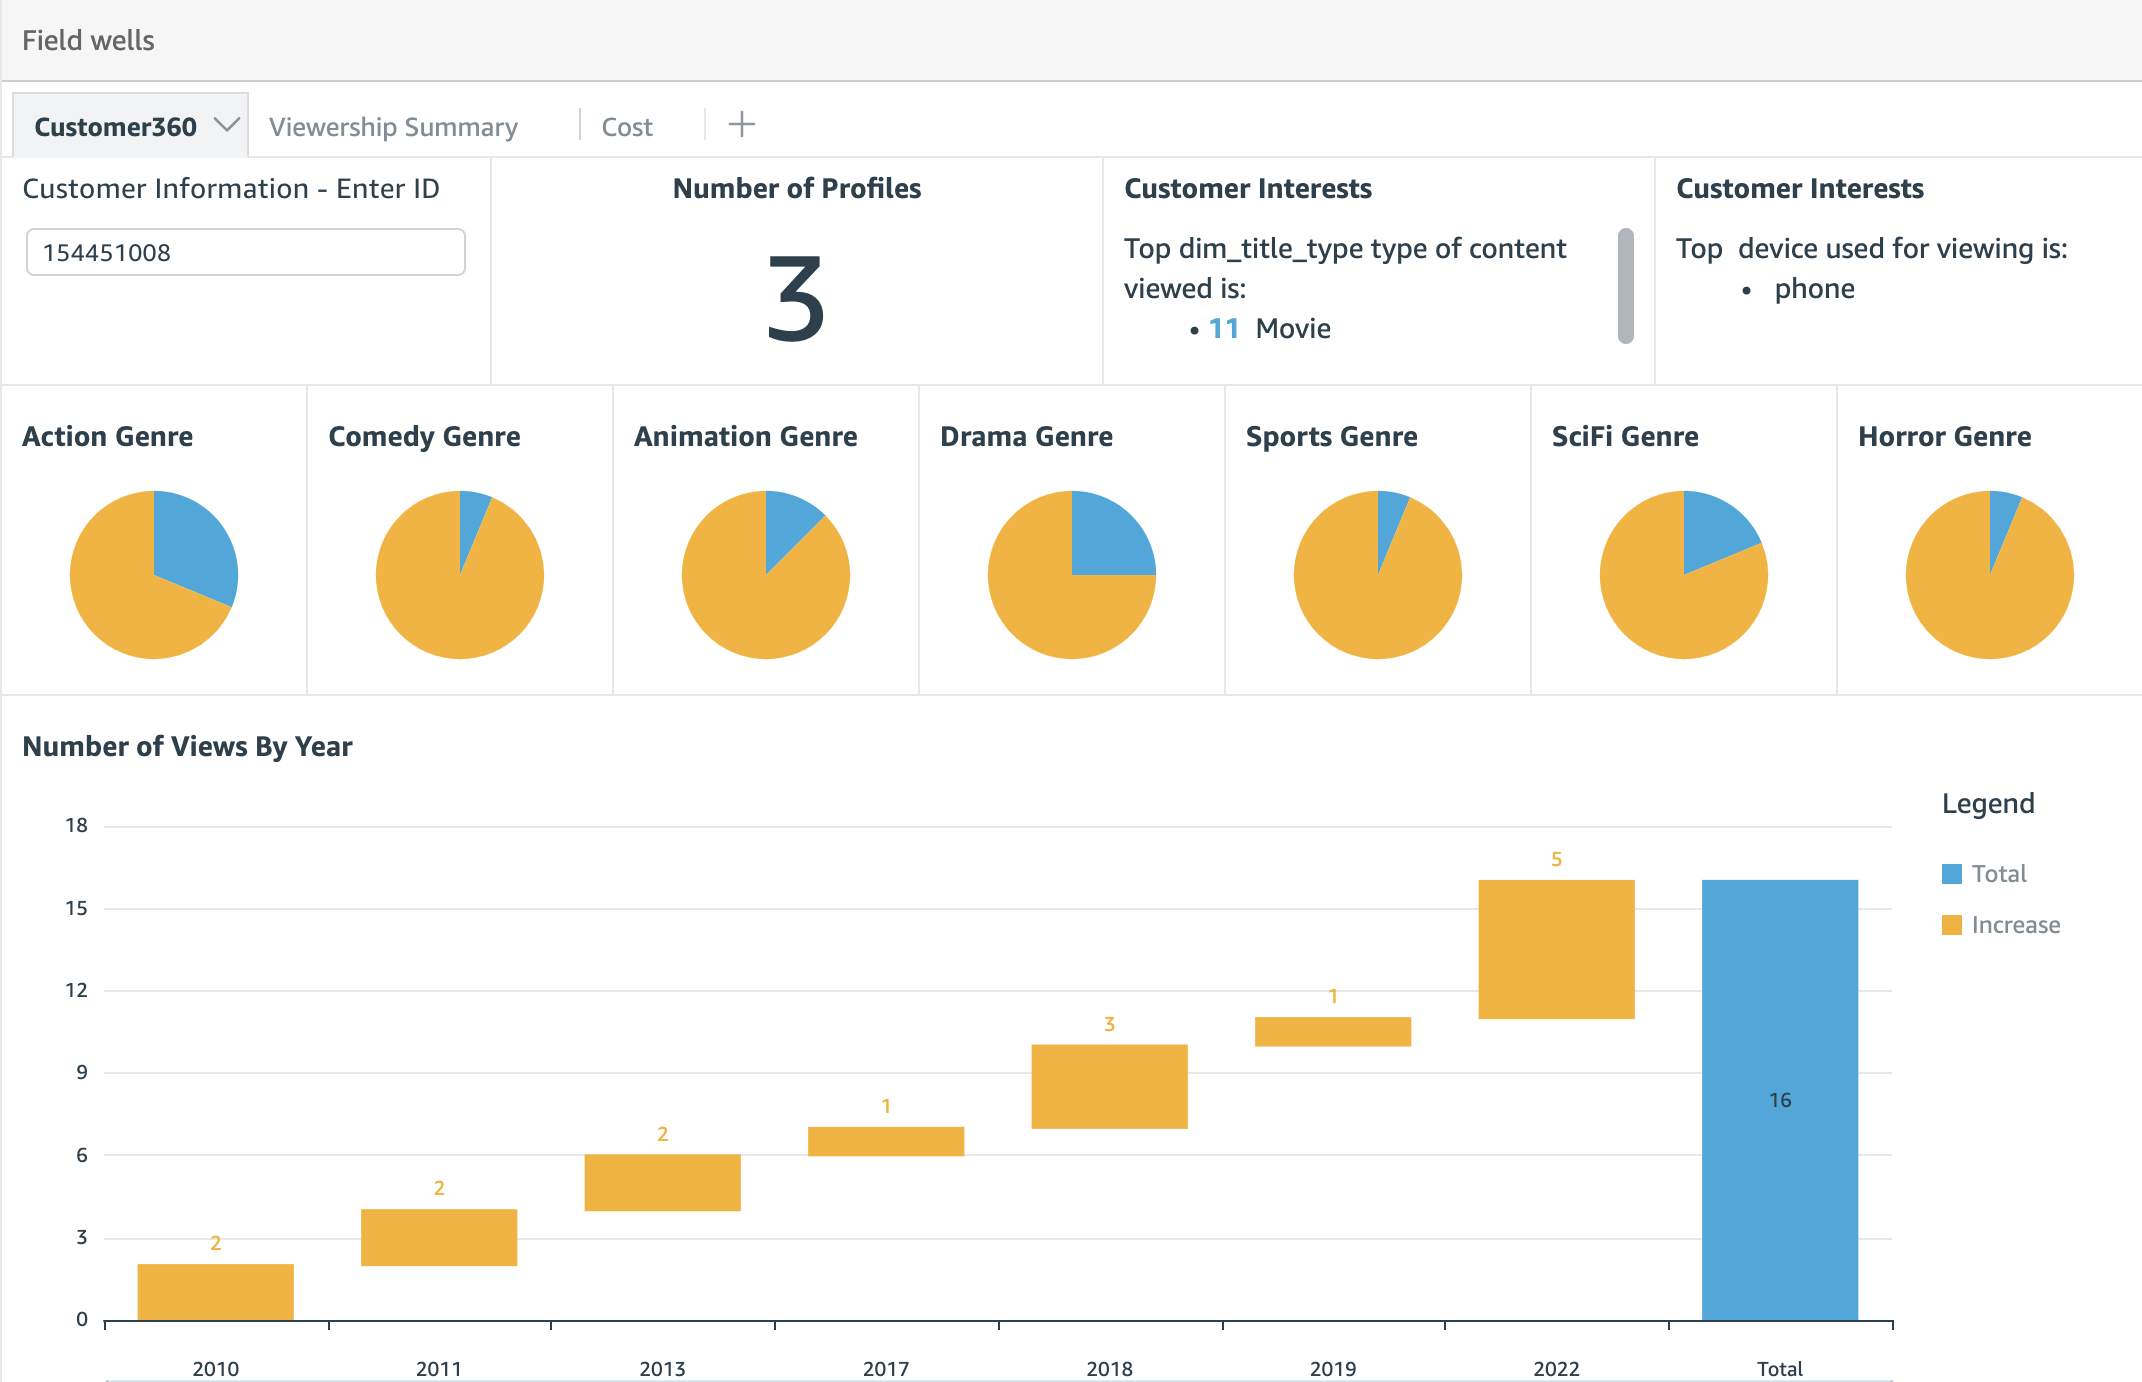
Dag executions would be complete by now. Now we can see data populated in the dahsboards. This dashboard is querying the Serverless Redshift endpoint using a direct query.
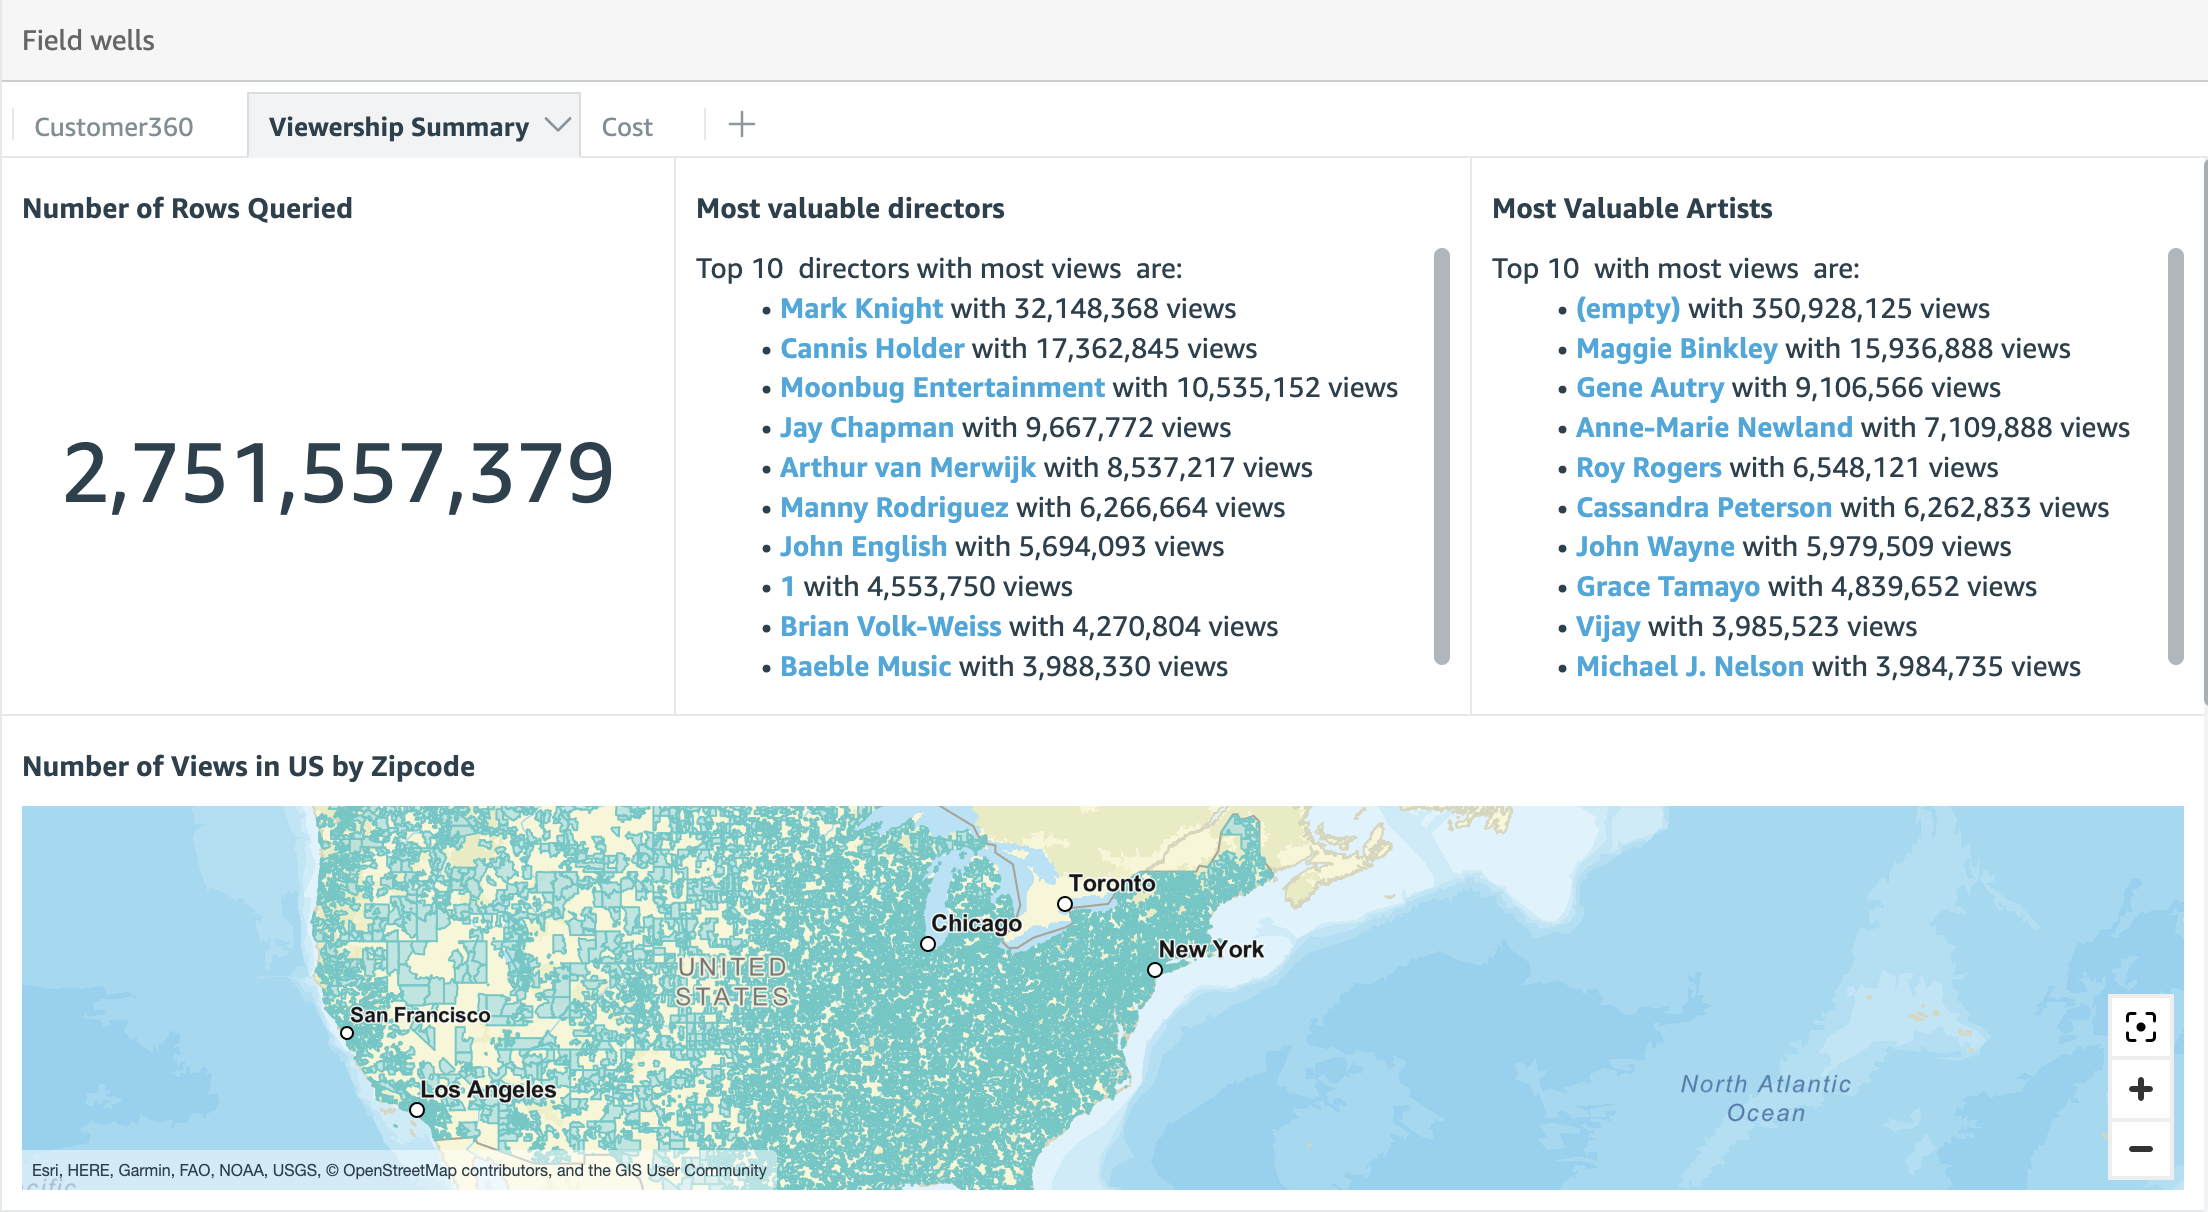
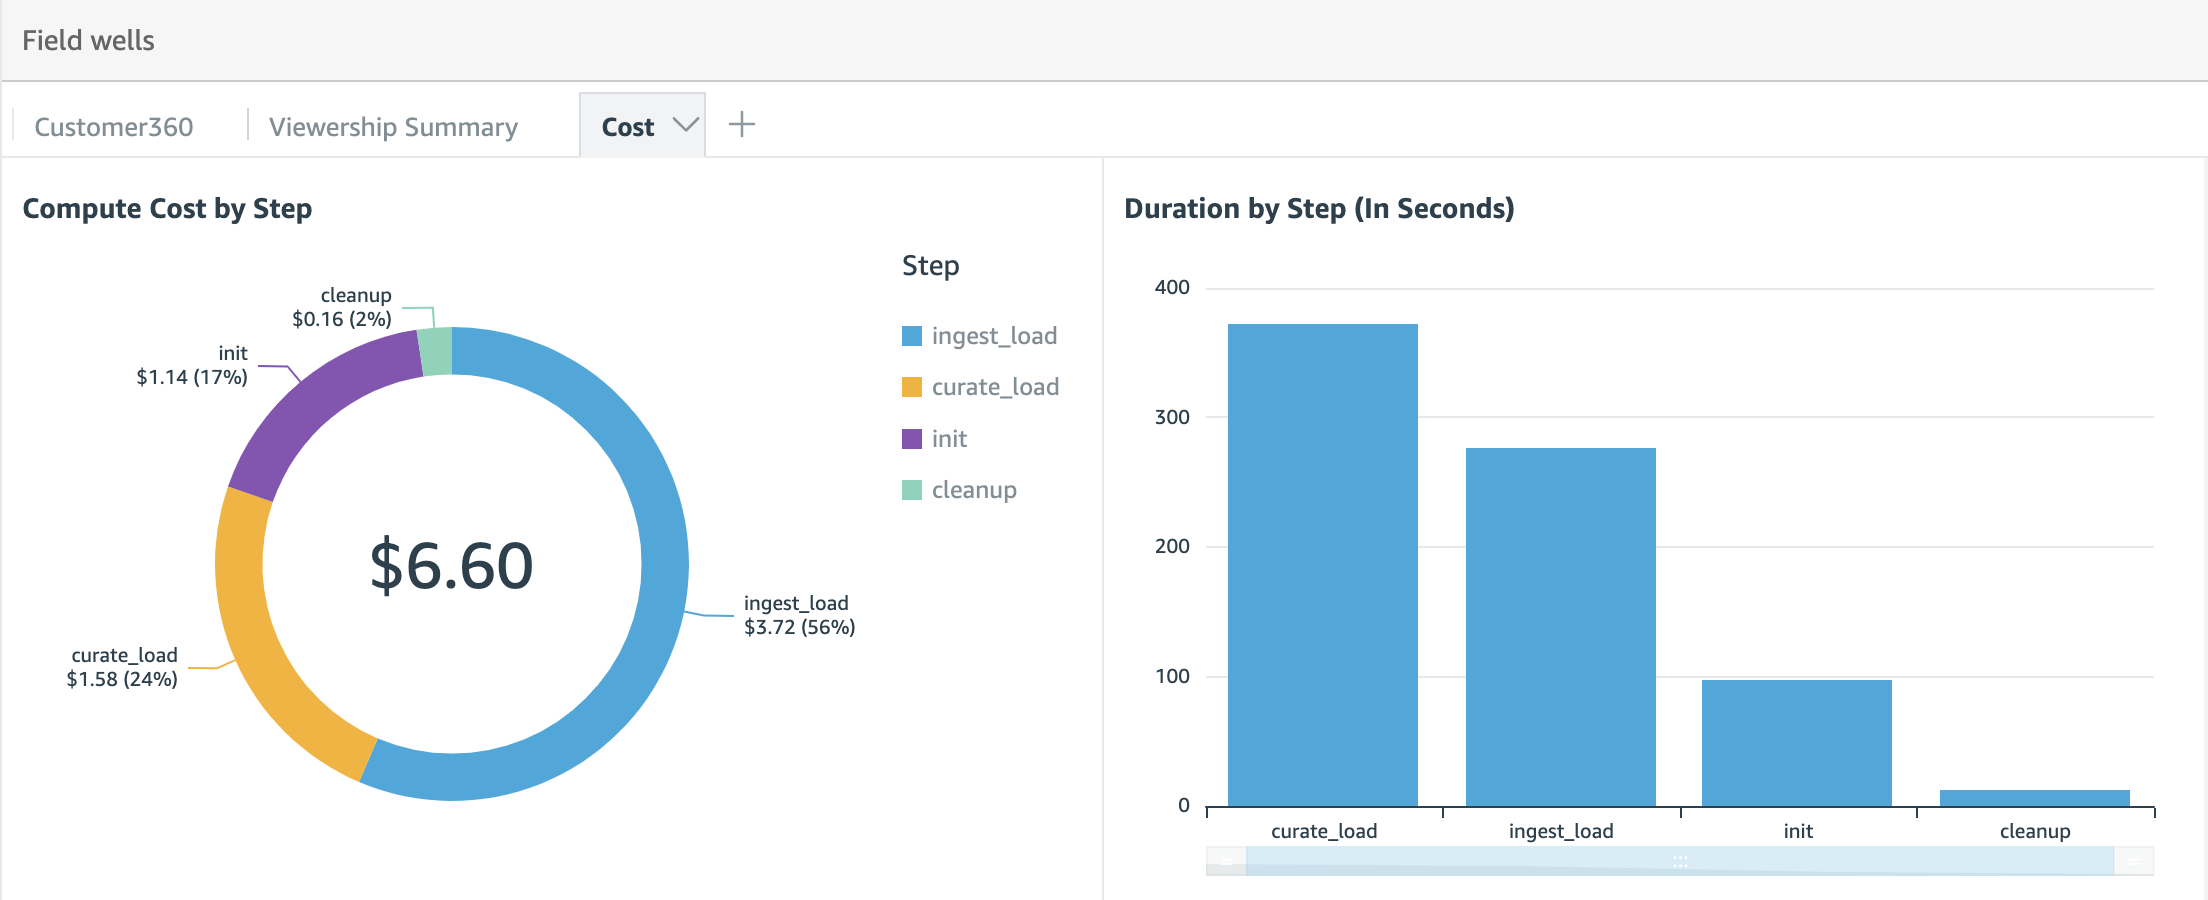
In the Customer 360, we are running queries to see data for a single customer. We can see visualizations for the customer ID provided - such as number of profiles, top category of content the customer viewed, viewing trend over years, genres that the customer is interested in etc., In the Viewership summary, we are running queries to summarize the entire dataset. We can see that the queries in this sheet are summarizing more than 2.75 billion rows. In this sheet, we can see valuable information such as most viewed directors, most viewed titles, viewership spread across zipcodes on a map etc The cost sheet depicts how much it costed to execute this workload. Under just $7, we are able to run an ingest, curate, and prepare a large workload for visual consumption. |
|
|
Cleanup data
Navigate to the link captured in CloudFormation output MwaaApacheAirflowUI
In the DAGs tab, under Actions tab for the Dag media_and_ent_demo_data_cleanup click on the PlayButton Icon and Click Trigger DAG to cleanup data. This DAG will execute for ~50 seconds
