Geospatial analysis
Demo Video

Before you Begin
Capture the following parameters from the launched CloudFormation template as you will use them in the demo.
https://console.aws.amazon.com/cloudformation/home?region=us-east-1#/stacks?filteringText=&filteringStatus=active&viewNested=true&hideStacks=false
- RedshiftClusterIdentifier
- RedshiftClusterUser
- RedshiftClusterPassword
The screenshots for this demo will leverage the SQL Client Tool of Redshift Query Editor. Be sure to complete the SQL Client Tool setup before proceeding.
Challenge
Miguel has recently been tasked to analyze geospatial data that will enable the business group that Miguel is part of, to visualize and explore geographic information and analytical results that pertain to finding cost effective travel accommodations for the sales team. Miguel will have to complete these tasks to meet the requirements:
Create tables
| Say | Do | Show | |
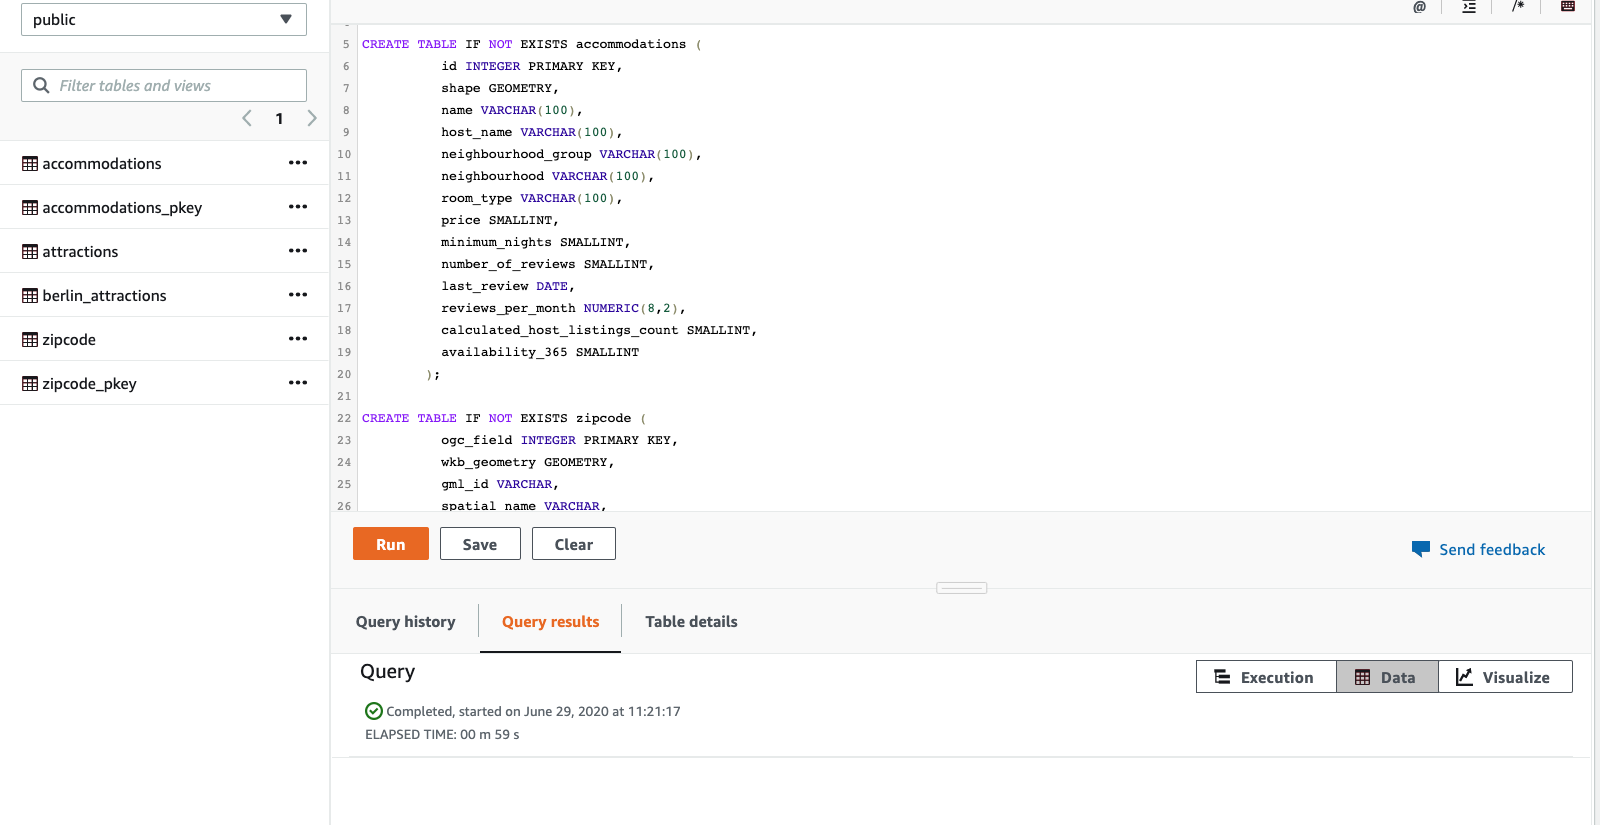
Miguel needs to create the table structures that will hold the geospatial data. He will use the new Geometry data type for the geospatial data. This new data type enables ingestion, storage, and queries against two-dimensional geographic data, as well as the ability to apply spatial functions to that data.
|
Create the tables as below:
DROP TABLE IF EXISTS accommodations;
DROP TABLE IF EXISTS zipcode;

CREATE TABLE IF NOT EXISTS accommodations (
          id INTEGER ,
          shape GEOMETRY,
          name VARCHAR(100),
          host_name VARCHAR(100),
          neighbourhood_group VARCHAR(100),
          neighbourhood VARCHAR(100),
          room_type VARCHAR(100),
          price SMALLINT,
          minimum_nights SMALLINT,
          number_of_reviews SMALLINT,
          last_review DATE,
          reviews_per_month NUMERIC(8,2),
          calculated_host_listings_count SMALLINT,
          availability_365 SMALLINT
        );

CREATE TABLE IF NOT EXISTS zipcode (
          ogc_field INTEGER,
          wkb_geometry GEOMETRY,
          gml_id VARCHAR,
          spatial_name VARCHAR,
          spatial_alias VARCHAR,
          spatial_type VARCHAR
        );
|
|
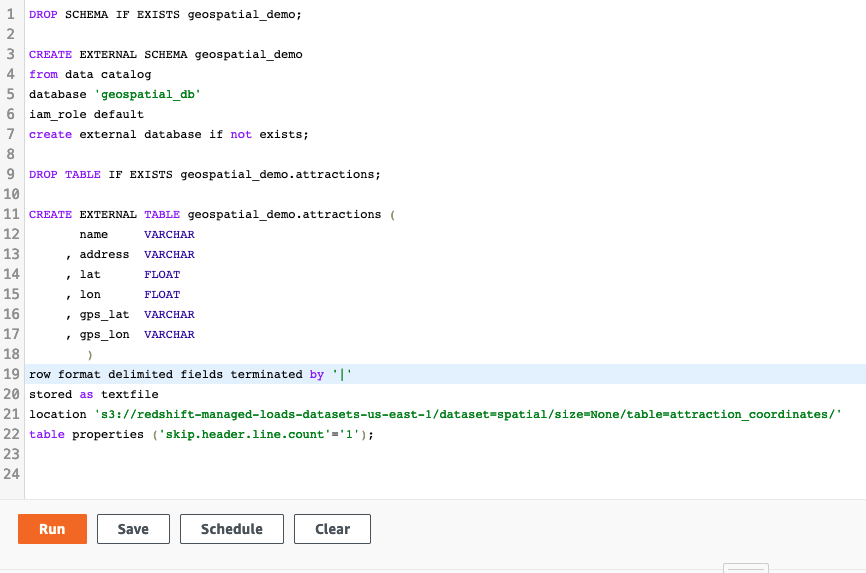
Miguel also needs to create an external schema and table to directly query geosptaial data in the S3 Data Lake using Redshift Spectrum geospatial capabilities. This enables Miguel to include new data coming in real-time, from mobile devices and other sources in his analysis.
Amazon Redshift now supports attaching the default IAM role.
If you have enabled the default IAM role in your cluster, you can use the default IAM role as follows. Follow the blog for details.
|
Create the external schema and table as below:
DROP SCHEMA IF EXISTS geospatial_demo;

CREATE EXTERNAL SCHEMA geospatial_demo
from data catalog
database 'geospatial_db'
iam_role default
create external database if not exists;

DROP TABLE IF EXISTS geospatial_demo.attractions;

CREATE EXTERNAL TABLE geospatial_demo.attractions (
       name     VARCHAR
     , address  VARCHAR
     , lat      FLOAT
     , lon      FLOAT
     , gps_lat  VARCHAR
     , gps_lon  VARCHAR
        )
row format delimited fields terminated by '|'
stored as textfile
location 's3://redshift-managed-loads-datasets-us-east-1/dataset=spatial/size=None/table=attraction_coordinates/'
table properties ('skip.header.line.count'='1');
|
|
Load data
| Say | Do | Show | |
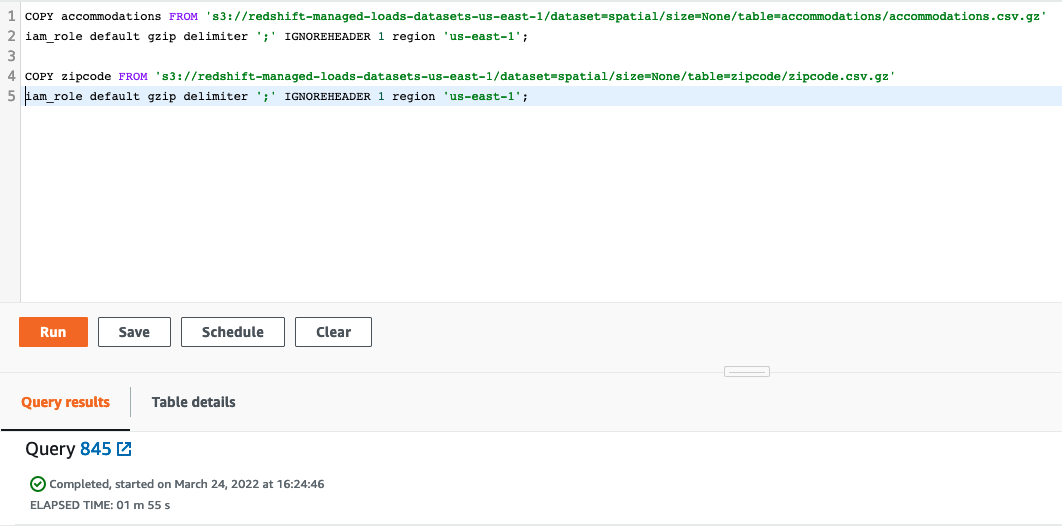
Miguel needs to load the data into the accomodations and zipcode tables. He will load data from CSV files stored on S3 buckets into these tables.
Amazon Redshift now supports attaching the default IAM role.
If you have enabled the default IAM role in your cluster, you can use the default IAM role as follows. Follow the blog for details.
|
Execute the below statements:
COPY accommodations FROM 's3://redshift-managed-loads-datasets-us-east-1/dataset=spatial/size=None/table=accommodations/accommodations.csv.gz' iam_role default gzip delimiter ';' IGNOREHEADER 1 region 'us-east-1';

COPY zipcode FROM 's3://redshift-managed-loads-datasets-us-east-1/dataset=spatial/size=None/table=zipcode/zipcode.csv.gz' iam_role default gzip delimiter ';' IGNOREHEADER 1 region 'us-east-1';
|
|
Analyze data
| Say | Do | Show |
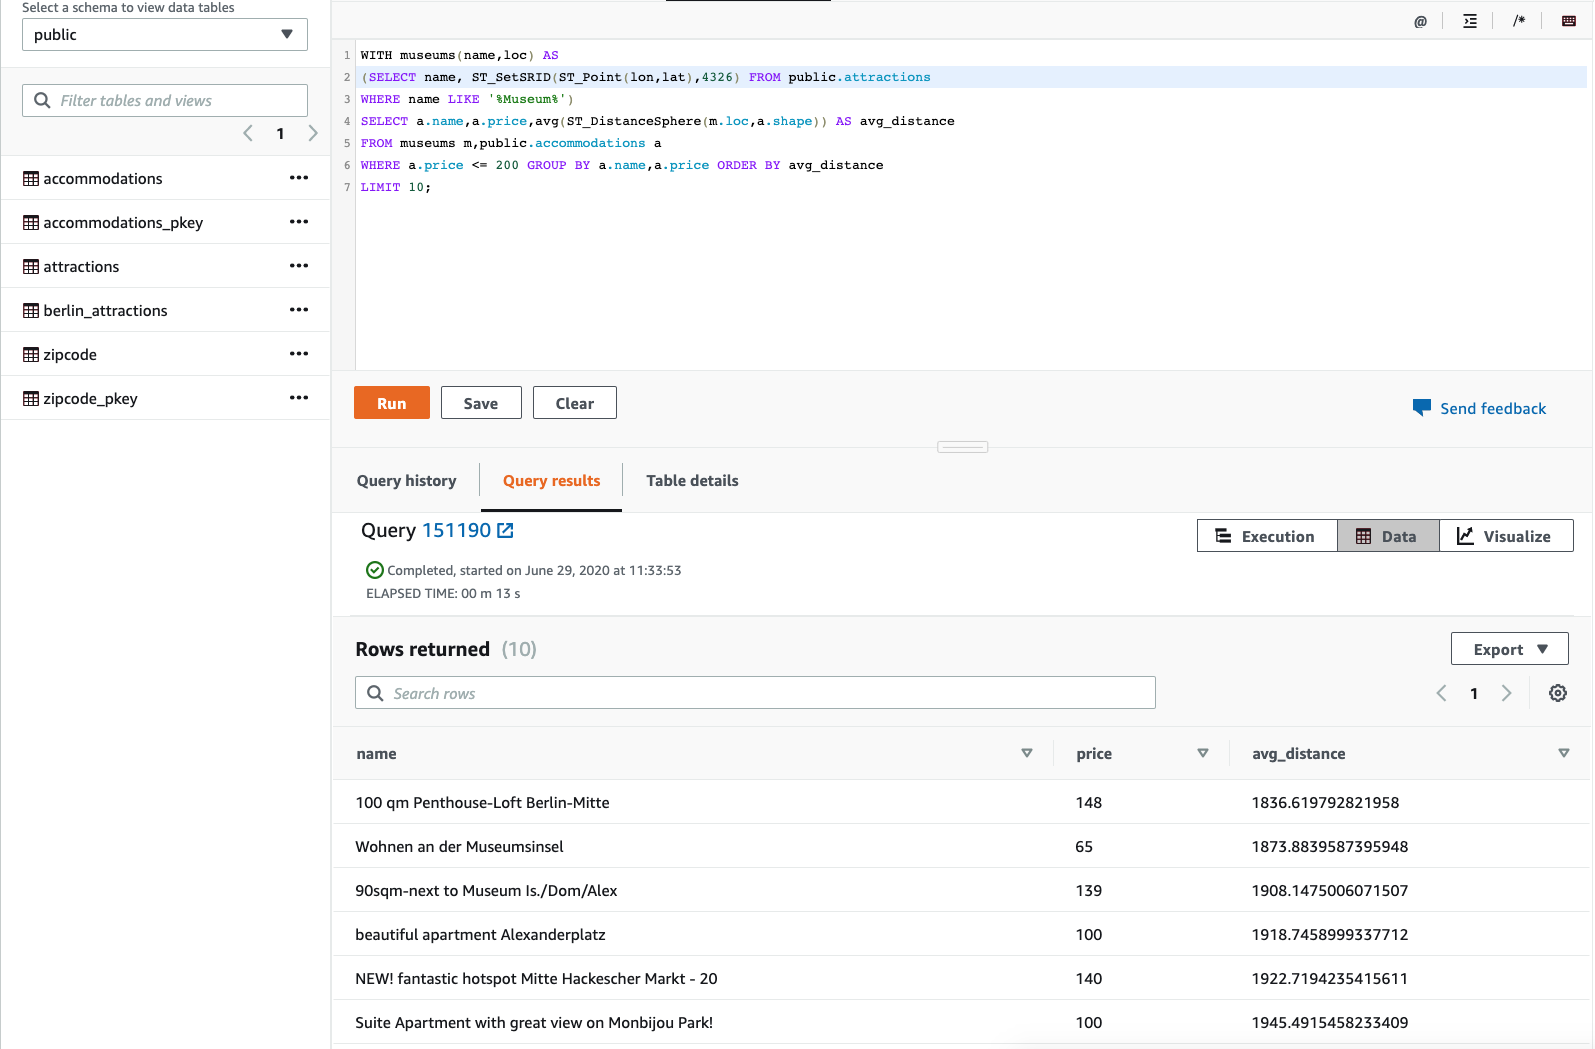
At this point Miguel has access to all the tables and data required for analysis. In the first analysis, Miguel writes a query to:
-
Find the geometry location from external table - attractions by using ST_Point function that returns a point geometry from the input coordinate values.
-
Find the average distance between the attractions and accommodations using the ST_DistanceSphere function that returns the distance between two point geometries lying on a sphere.
|
Execute the below statement:
WITH museums(name,loc) AS
(SELECT name, ST_SetSRID(ST_Point(lon,lat),4326) FROM geospatial_demo.attractions
WHERE name LIKE '%Museum%')
SELECT a.name,a.price,avg(ST_DistanceSphere(m.loc,a.shape)) AS avg_distance
FROM museums m,public.accommodations a
WHERE a.price <= 200 GROUP BY a.name,a.price ORDER BY avg_distance
LIMIT 10;
|
|
|
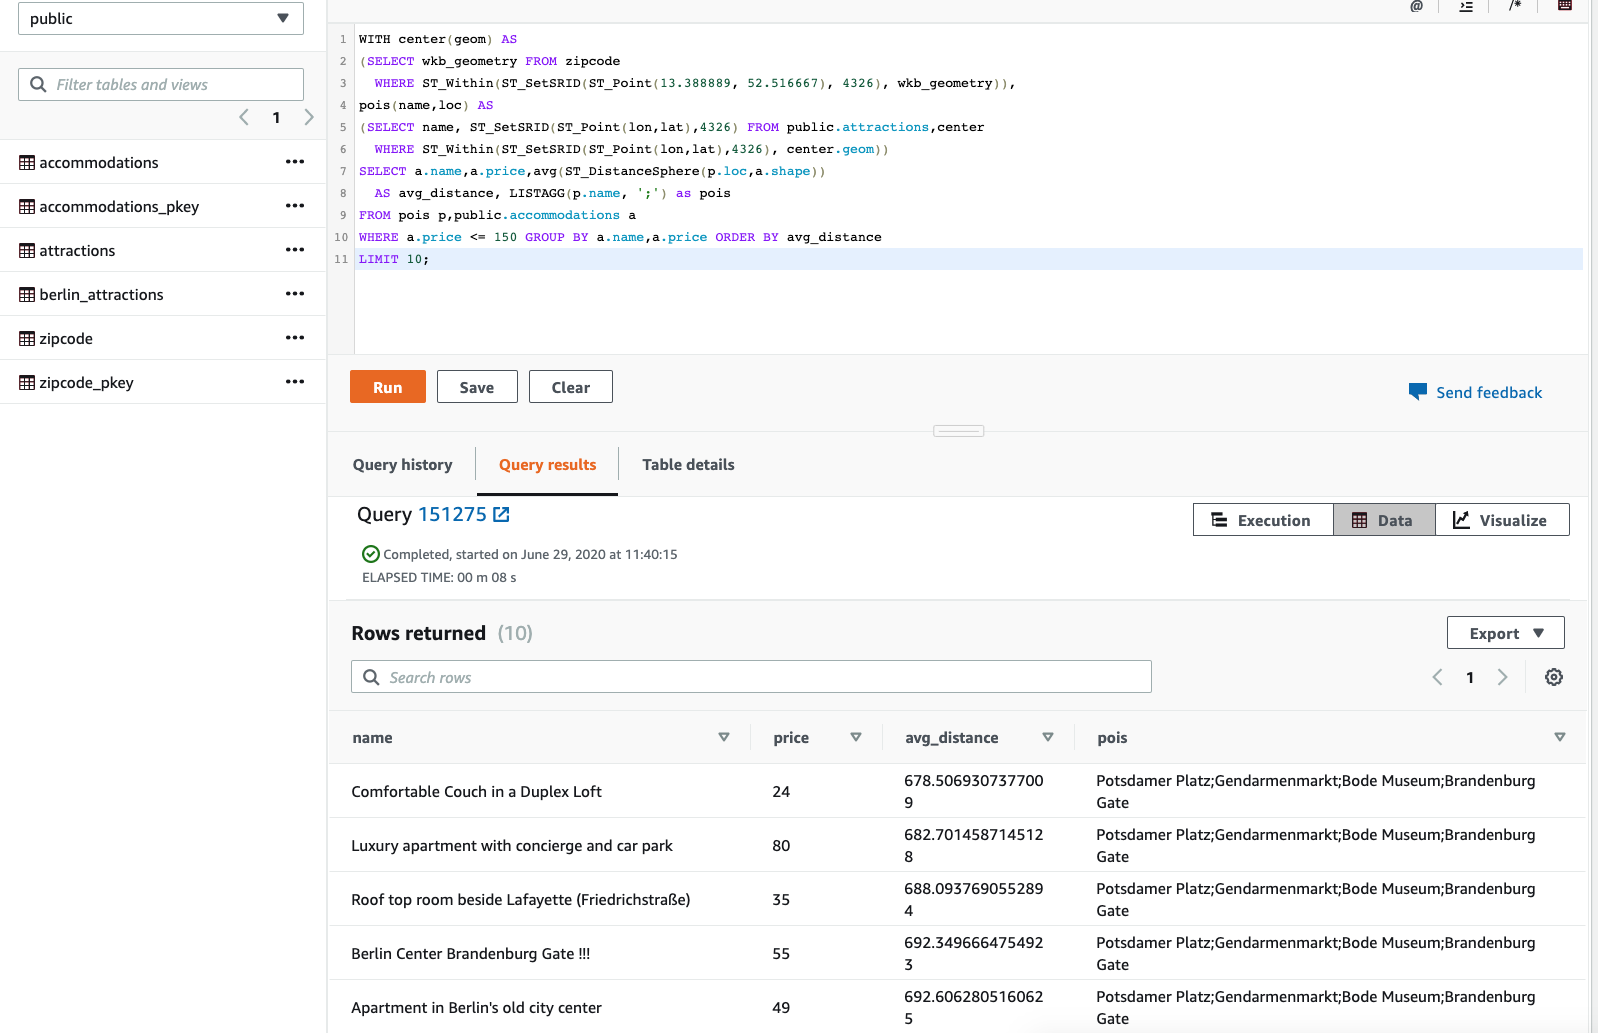
Next, Miguel wants to do one more analysis to find the center of city but isn’t sure what attractions or accommodations are present in the central district. Miguel writes a query:
- From the available (latitude 52.516667, longitude 13.388889) information, find the the polygon enclosing that region of the city by using ST_Point function that returns a point geometry from the input coordinate values and ST_Within returns true if the first input geometry is within the second input geometry.
- Use the center of the city polygon from #1 and list accommodations by average distance from center by using ST_DistanceSphere, ST_DistanceSphere returns the distance between two point geometries lying on a sphere.
|
Execute the below statement:
WITH center(geom) AS
(SELECT wkb_geometry FROM zipcode
  WHERE ST_Within(ST_SetSRID(ST_Point(13.388889, 52.516667), 4326), wkb_geometry)),
pois(name,loc) AS
(SELECT name, ST_SetSRID(ST_Point(lon,lat),4326) FROM geospatial_demo.attractions,center
  WHERE ST_Within(ST_SetSRID(ST_Point(lon,lat),4326), center.geom))
SELECT a.name,a.price,avg(ST_DistanceSphere(p.loc,a.shape))
  AS avg_distance, LISTAGG(p.name, ';') as pois
FROM pois p,public.accommodations a
WHERE a.price <= 150 GROUP BY a.name,a.price ORDER BY avg_distance
LIMIT 10;
|
|
Visualize Data
| Say | Do | Show | |
Geospatial data is more easily analyzed visually using map views. Miguel will setup and use Quicksight to accomplish this task. Other business intelligence and reporting tools can also be used to accomplish this task as long as they can maintain a JDBC connection and query for source data in SQL.
Replace the value for <RedshiftClusterIdentifier> with the value previously determined.
|
- Navigate to Quicksight
- Click the
Manage Data button
- Click the
New dataset button
- Click the
Redshift auto-discovered button
- In the pop-up, enter the following in each field:
- Data source name: any name you want e.g. GermanyGeoData
- Instance ID:
<RedshiftClusterIdentifier>
- Connection type:
Public network
- Username:
<RedshiftClusterUser>
- Password:
<RedshiftClusterPassword>
- Click
Validate Connection and confirm that the it changes to Validated
- Click
Create data source button
|

|
|
Once the connection is established Quicksight will need to know which tables to query.
|
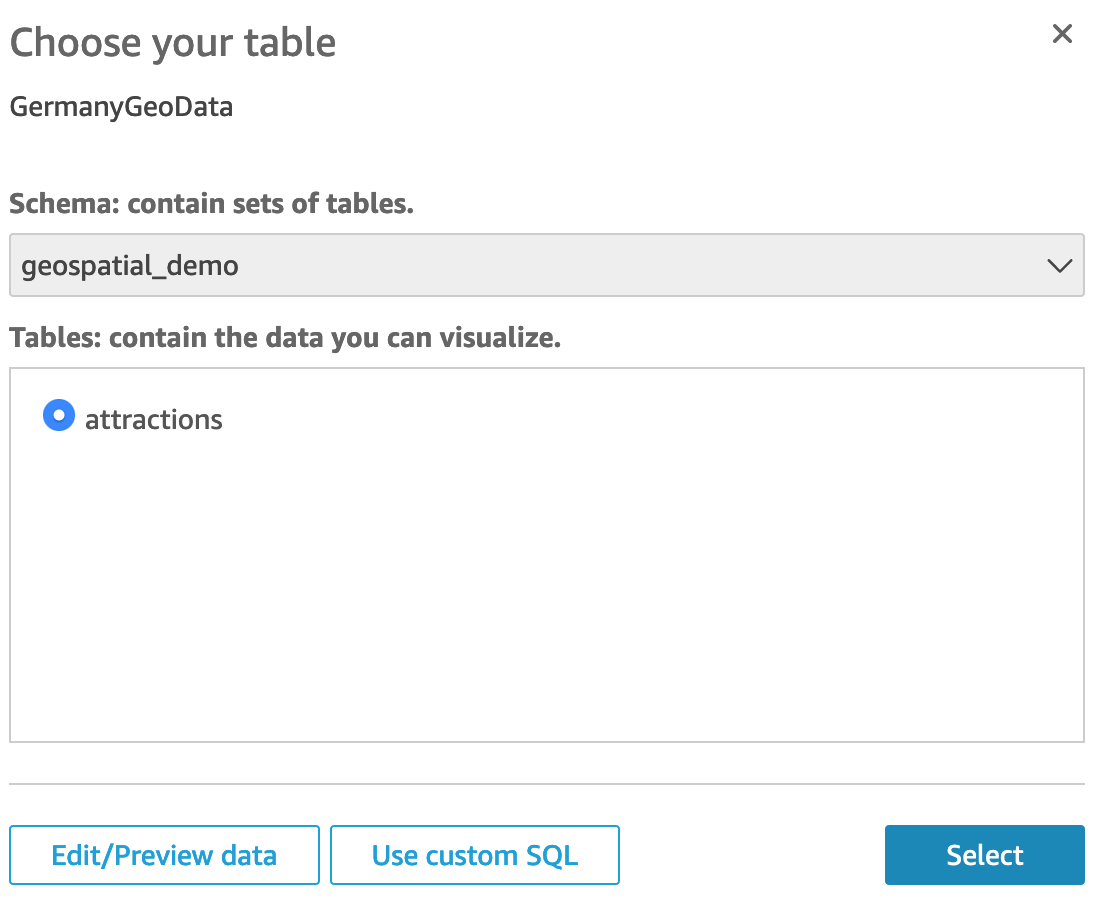
On the next pop-up, make the following selections:
- Schema:
geospatial_demo
- Tables:
attractions
- Then click the
Select button
- Then select the
Directly query your data radio button
- and click
Visualize button
|

|
|
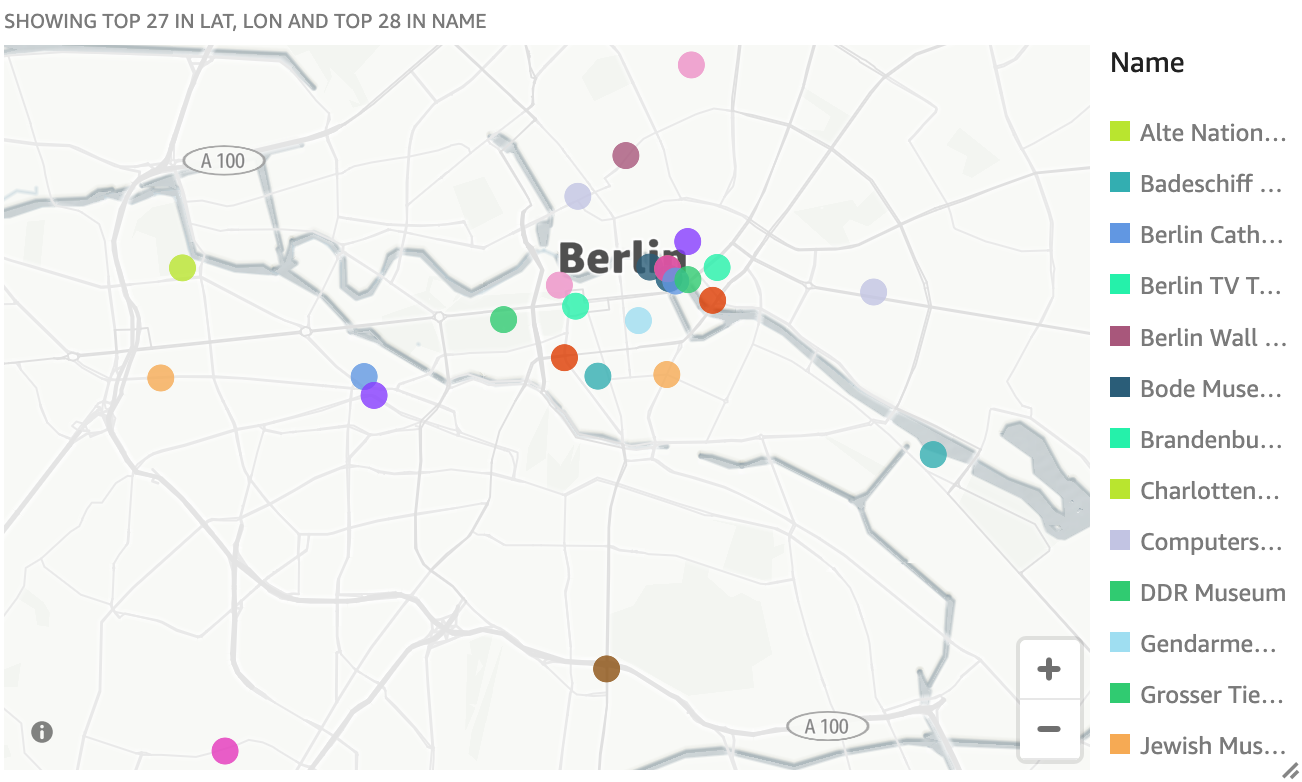
Miguel can now display the attractions as a visual map display in Quicksight that can be shared with people in a gallery, story or embeddable map feeding geospatial data from Redshift.
|
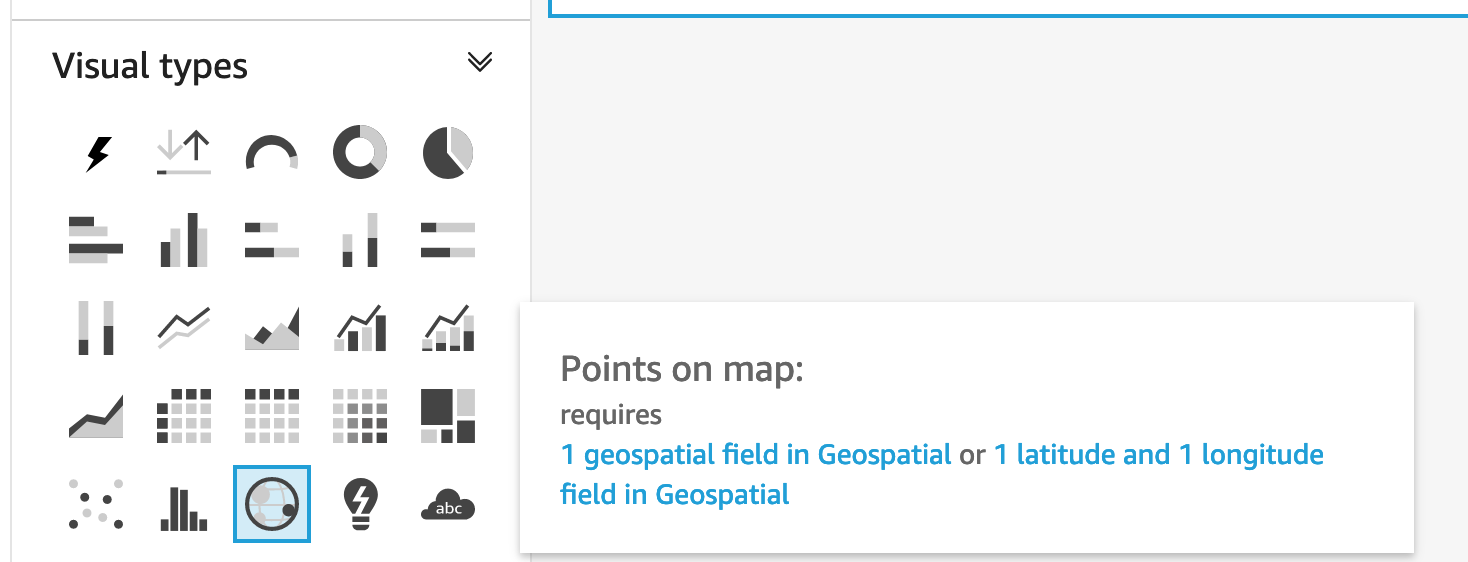
New window opens up to allow you to build a visual map.
- In the
Visual Types tab, select points on a map visual type
- In the
Field wells, make the following selections:
- geospatial: select both
lat and lon
- color:
name
Visual map is now visible
|

|
Before you Leave
Execute the following to clear out any changes you made during the demo to reset it. You may also delete the Quicksight Dataset and Quicksight Analysis but this is not needed as you can choose a new name next time as well.
DROP TABLE IF EXISTS accommodations;
DROP TABLE IF EXISTS zipcode;
DROP SCHEMA IF EXISTS geospatial_demo;
DROP TABLE IF EXISTS geospatial_demo.attractions;
If you are done using your cluster, please think about deleting the CFN stack or to avoid having to pay for unused resources do these tasks:
- pause your Redshift Cluster
- stop the Oracle database
- stop the DMS task


