Data Profiling with Data Brew
Demo Video
Coming soon!
Before you Begin
Capture the following parameters from the launched CloudFormation template as you will use them in the demo.
https://console.aws.amazon.com/cloudformation/home?region=us-east-1#/stacks?filteringText=&filteringStatus=active&viewNested=true&hideStacks=false
- RedshiftClusterDetails – Redshift Cluster, Database Name, Database User and Database Password
- GlueBucketName
- GlueServiceRedshiftRole
Client Tool
The screenshots for this demo will leverage the Redshift Query Editor. Alternatives to the Redshift Query Editor can be found on the SQL Client Tool page.
Challenge
Sumer has recently been tasked with preparing data for a machine learning use case. Source data set is available in Redshift and is created by aggregating various data sets in Redshift. However, she needs to clean, profile, normalize and apply transformations on that aggregated data to prepare it for predictive analytics. She needs to prep the data for use cases that will predict items most sold over a period of time and identify correlations to demographic data. She would like to do the data preparation visually and quickly and does not want to prepare the data by writing code. To solve this challenge Sumer will:
- Connect to the data set
- Create a Glue Data Brew Project
- Create a Profiler job and view profiled data
- Transform, Clean and Normalize the data and create a Receipe
- Create scheduled outputs
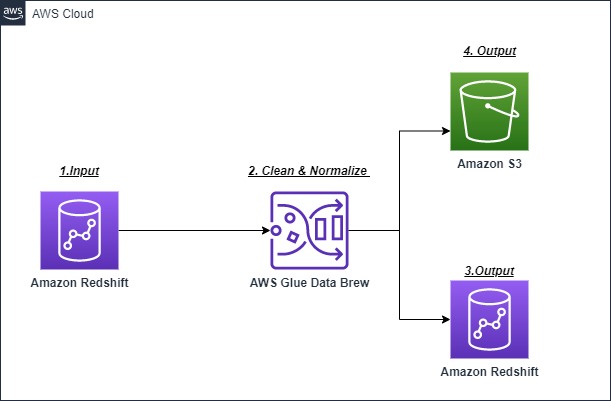
Here is the architecture of this setup:
Connect to the data set
| Say | Do | Show |
|---|---|---|
| Sumer needs to analyze the data set and see what it looks like. It’s hard to look at large data sets across columns and determine their quality without using SQL on each data type and value. She needs to find an easy way to accomplish this task, she decides to give AWS Glue Data Brew service a try. |
|

|
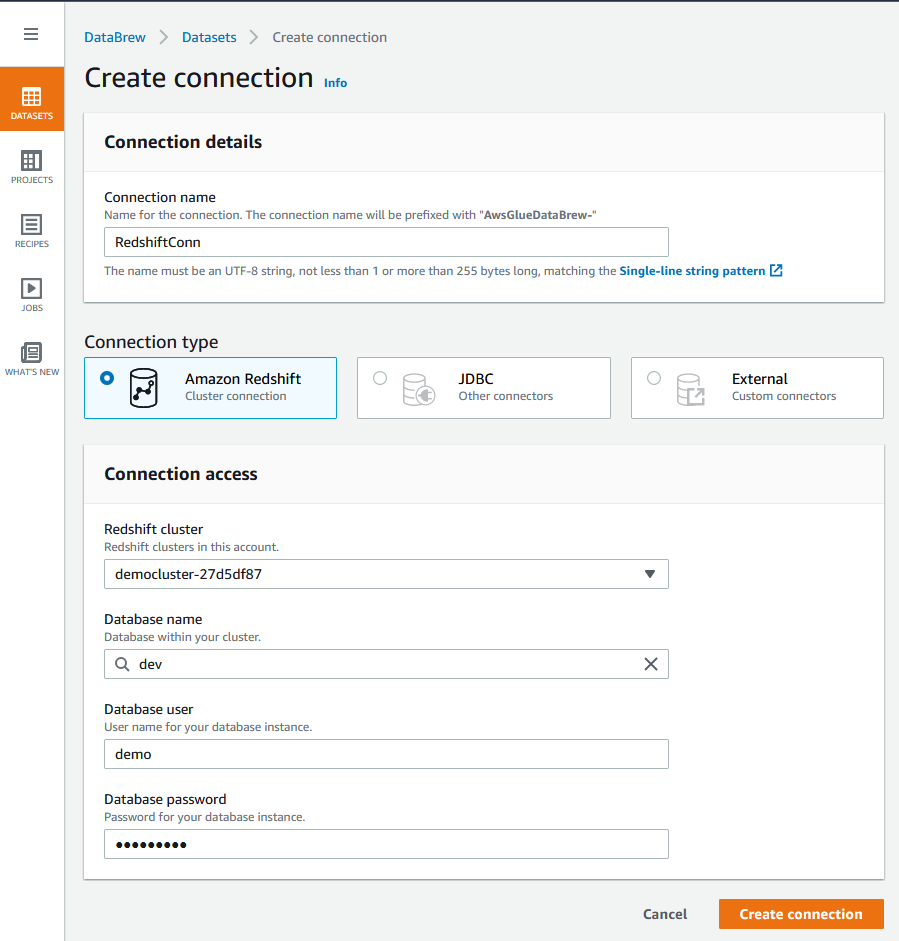
| Sumer needs to create a connection from the Glue Data Brew service to Redshift, where the data to be analyzed is hosted. She will provide connection credentials and other information so that Data Brew can connect to the data source. |
|
|
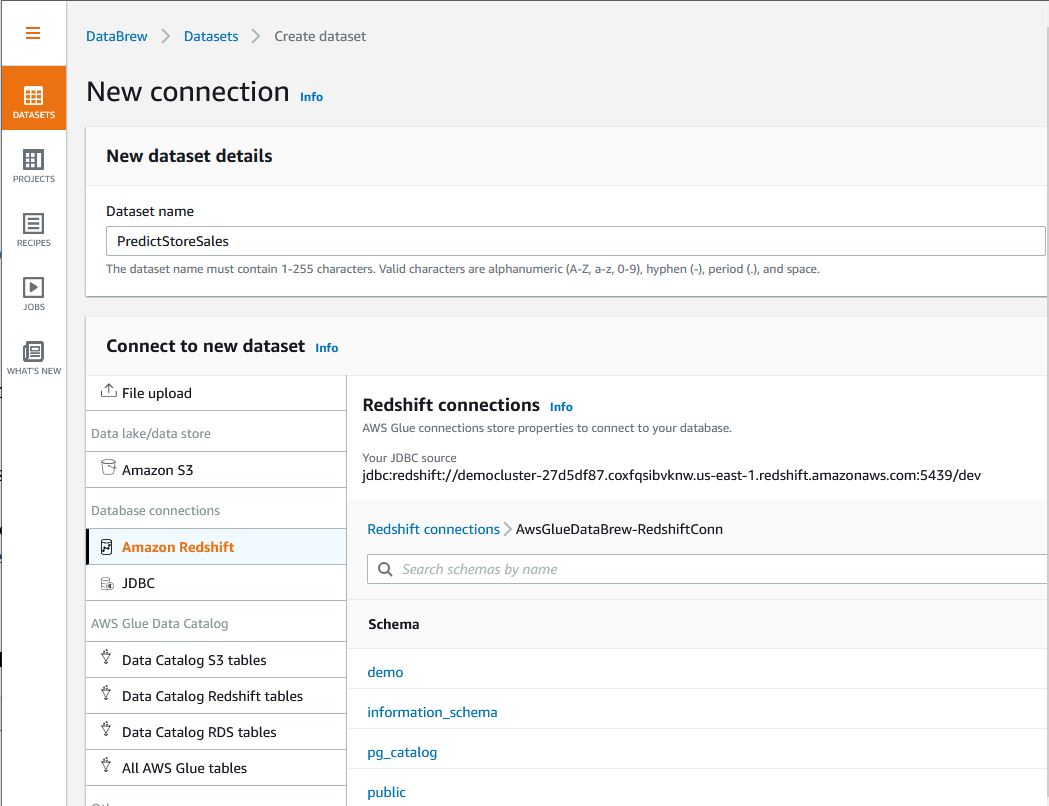
| Sumer creates a Glue Data Brew Dataset from the Redshift connection |
Predict Store Salespublic schemapredict in the search bar and select Predict_Store_Sales table
|



|
| Finally, Sumer selects the S3 bucket to store Glue Data Brew Intermediate results |
|

|
Create Glue DataBrew project
| Say | Do | Show |
|---|---|---|
| Sumer needs to create a Glue Data Brew Project to manage the data set |
| 

|
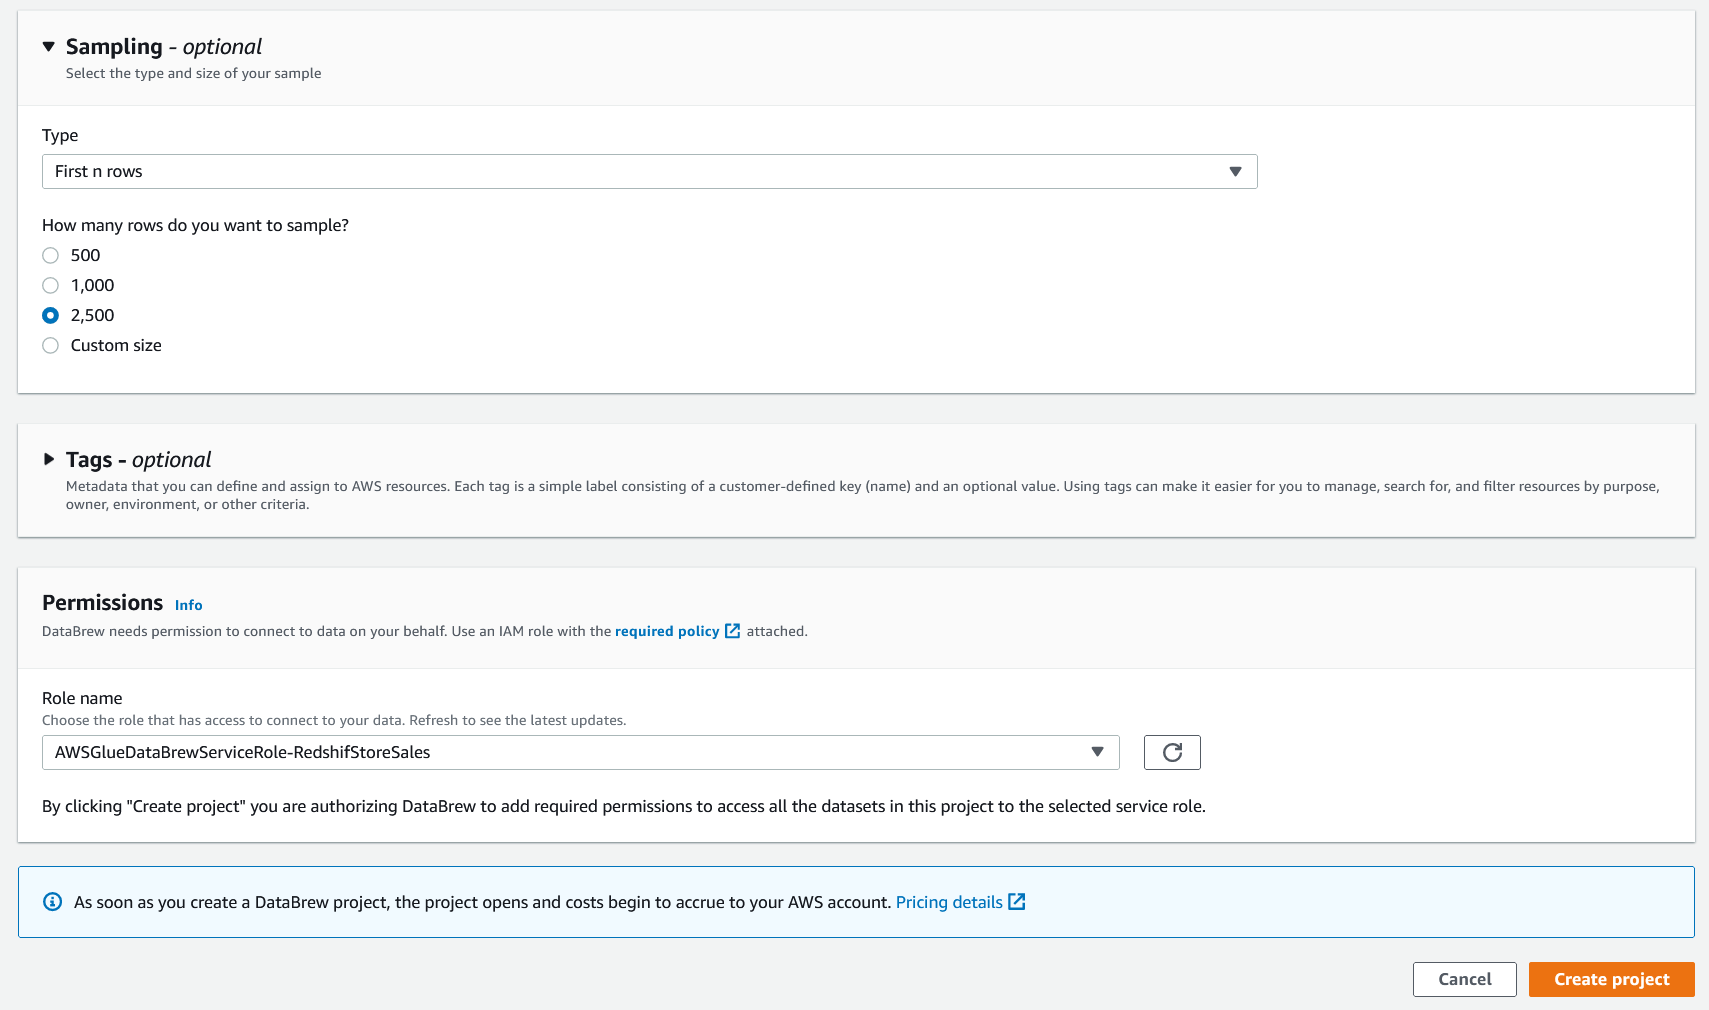
| Sumer needs to provide a Glue Data Brew IAM role to execute grant appropriate access to the service |
2500 as the sample rowsGlueRole-ff3d2f16Create Project button
|
 |
Profile the data
| Say | Do | Show |
|---|---|---|
| After Sumer creates the project, DataBrew helps you evaluate the quality of your data by profiling it to understand data patterns and detect anomalies |
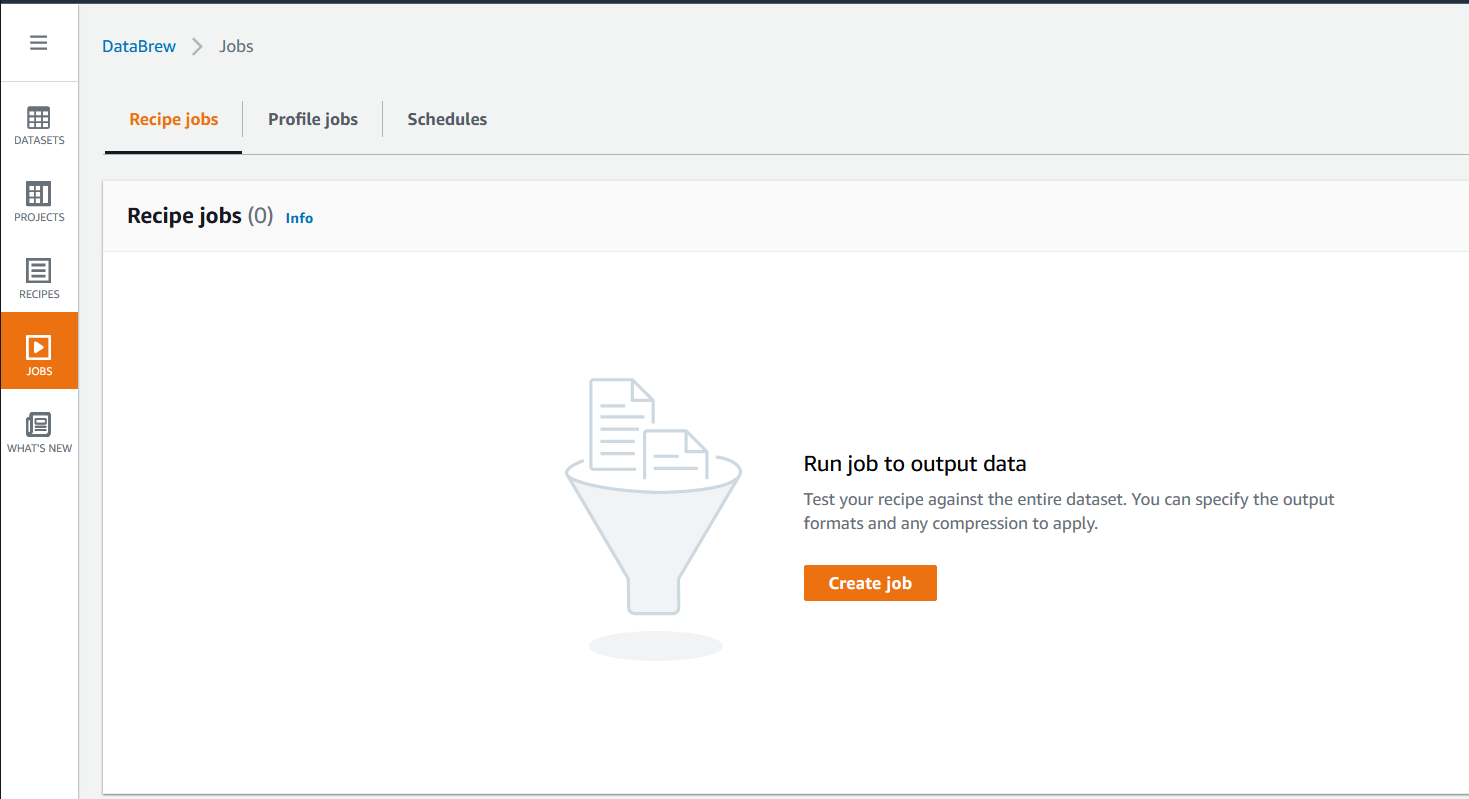
To create your profiling job, complete the following steps:
| 
|
|
Sumer will create Data Brew profiler job to profile the data in the dataset and will need to provide Input Parameters for creating Profiler Job | Input the following parameters for Profiler Job:
|  |
|
Sumer Provides S3 bucket and Glue role to execute profiler job This step can take some time to complete, please plan ahead and be ready to talk about the service in general while this job runs. Run time is approximately 5 min or less |
Input following parameters for Profiler Job :
| 
|
Sumer chooses the Column statistics tab, and notices that ItemQty column has some missing values
|
Once the Profiler Job is created and completed a run, Click on View Data Profile under Data Profile
| 
|
|
Based on the |
select ItemQty column and notice that 1% of the values are missing
|

|
Sumer also notices that Item Quantity is an outlier |
select ItemQty Column in columns section and click on outliers on the right to notice the outlier identified in the dataset
|

|
Create a transformation Recipe
| Say | Do | Show |
|---|---|---|
| Sumer wants to build a transformation Recipe | Click on Projects tab on the left menu
|  |
|
All ML algorithms use input data to generate outputs. Input data comprises features usually in structured columns. To work properly, the features need to have specific characteristics. This is where feature engineering comes in. Sumer drops the unnecessary columns from the dataset that aren’t required for model building |
|  |
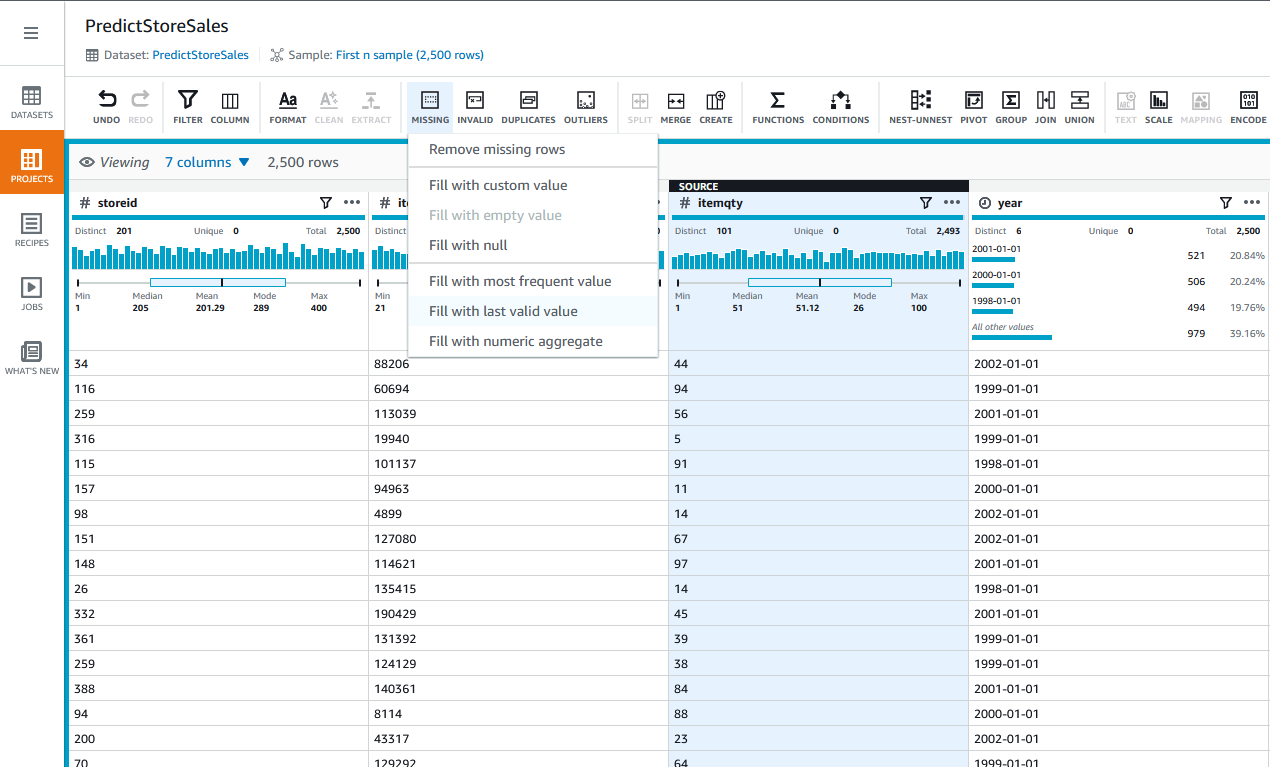
Sumer notices in the profiling report that the ItemQty column is missing a few records, she filla in the missing valuea with the median ItemQty of other records
|
Missing on the top menuFill with Numerical Aggregate
|  |
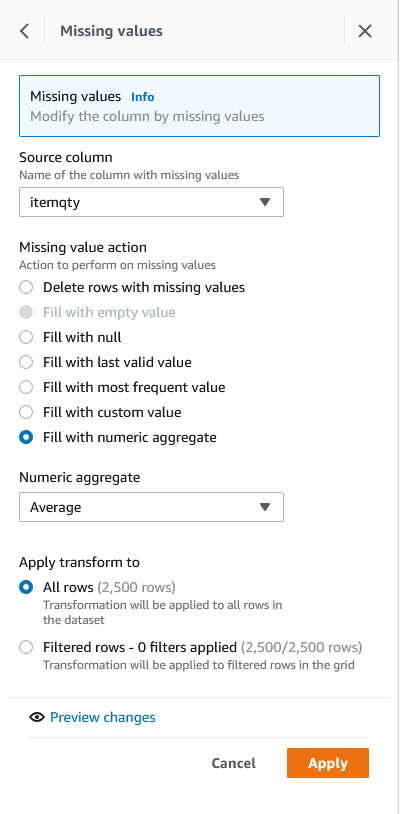
Sumer fills all the missing values with numerical aggregate of ItemQuantity
|
Source column as ItemQtyNumeric aggregate, choose MedianApply transform to, select All rowsApply
|
|
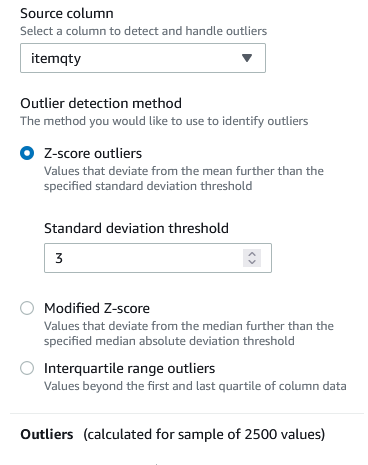
Sumer knows from the profiling report that the ItemQty column has one outlier, which she can remove
|
Choose Outliers and choose Remove outliers
|

|
| Sumer removes outliers identified during data profile |
study_time_in_hrZ-score outliers.Standard deviation threshold, choose 3
|
 |
| Sumer provides required parameters to remove rows associated with the outlier. |
Outlier actions, select Remove outliersRemove outliers, select `All outliersOutlier removal options¸ Choose Delete rowsApply
|
 |
| Sumer needs to convert the categorical value to a numerical value for the gender column. |
MappingCategorical mapping
|

|
| Sumer provides Mapping values for choose Categorical mapping |
For Source column:
genderMapping options, select Map top 1 valuesMap values, select Map values to numeric valuesM, choose 1others, choose 2
|
 |
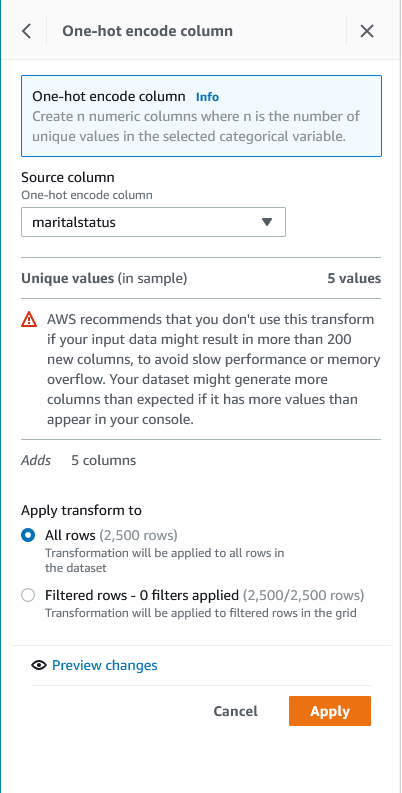
| ML algorithms often can’t work on label data directly, requiring the input variables to be numeric. One-hot encoding is one technique that converts categorical data that don’t have an ordinal relationship with each other to numeric data, hence Sumer converts categorical data into numeric data as a next step. |
To apply one-hot encoding, complete the following steps:
EncodeOne-hot encode column
|

|
| Sumer provides required parameters for one-hot encoding |
To apply one-hot encoding, complete the following steps:
EncodeOne-hot encode column
|
|
| Once mapping and one hot encoding are complete, Sumer deletes original gender and material columns to further clean the data set |
Select Columns from the top menu and click on Delete
|

|
Sumer deletes gender and marital status columns
|
gender and maritalstatus checkboxApply in the right hand menu
|

|
Sumer intends to convert year column in the data set into yyyymmdd format
|
Click on ... on the right hand corner of year column, navigate to Format->Data-time formats -> yyyy-mm-dd |
 | | |
| Sumer applies data format change to all the rows in the data set. |
Ensure that year is selected in the Source Column list and choose date-time format as yyyymmdd, check All Rows radio button and click on Apply
|
 |
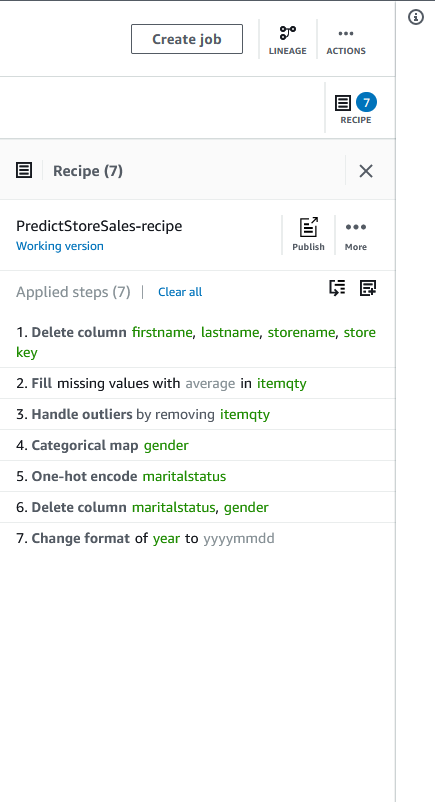
| Finally, Sumer has the summary of all the data prep changes. |
Click on Recipe on the top right corner to view the final summary of all the steps applied so far
|
 |
|
Sumer has the final recipe, she will create a recipe job to schedule data prep on daily basis |
Click on Create Job on the top to Create a Recipe Job
|
 |
create recipe
| Say | Do | Show |
|---|---|---|
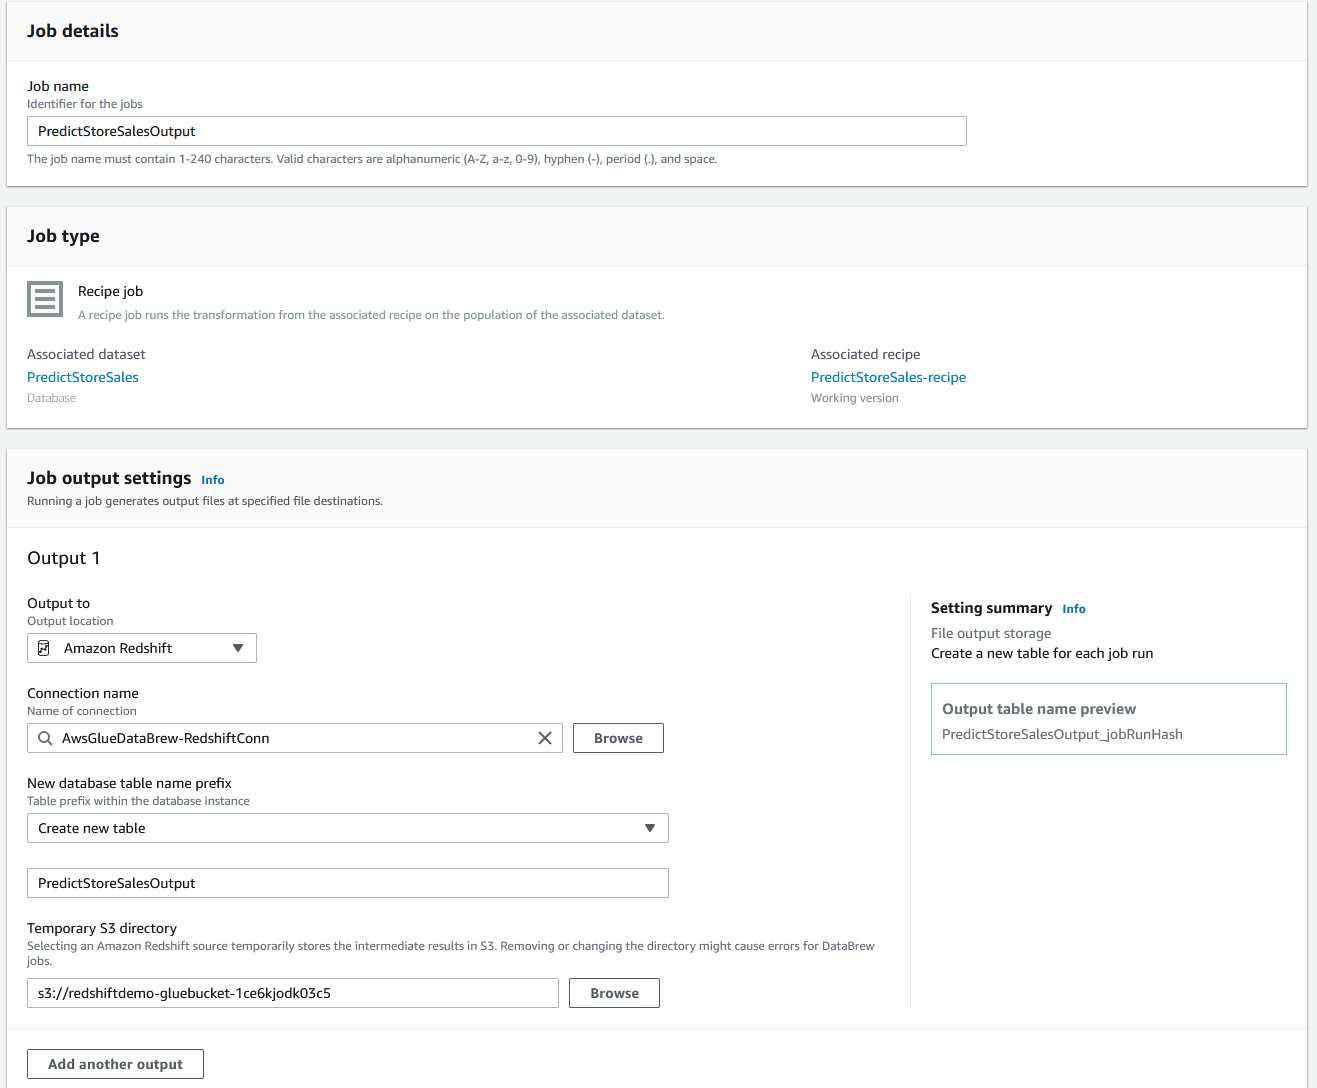
| Sumer would like to create a Recipe output to a Redshift table so that ML Engineers can use the cleaned dataset. |
| 
|
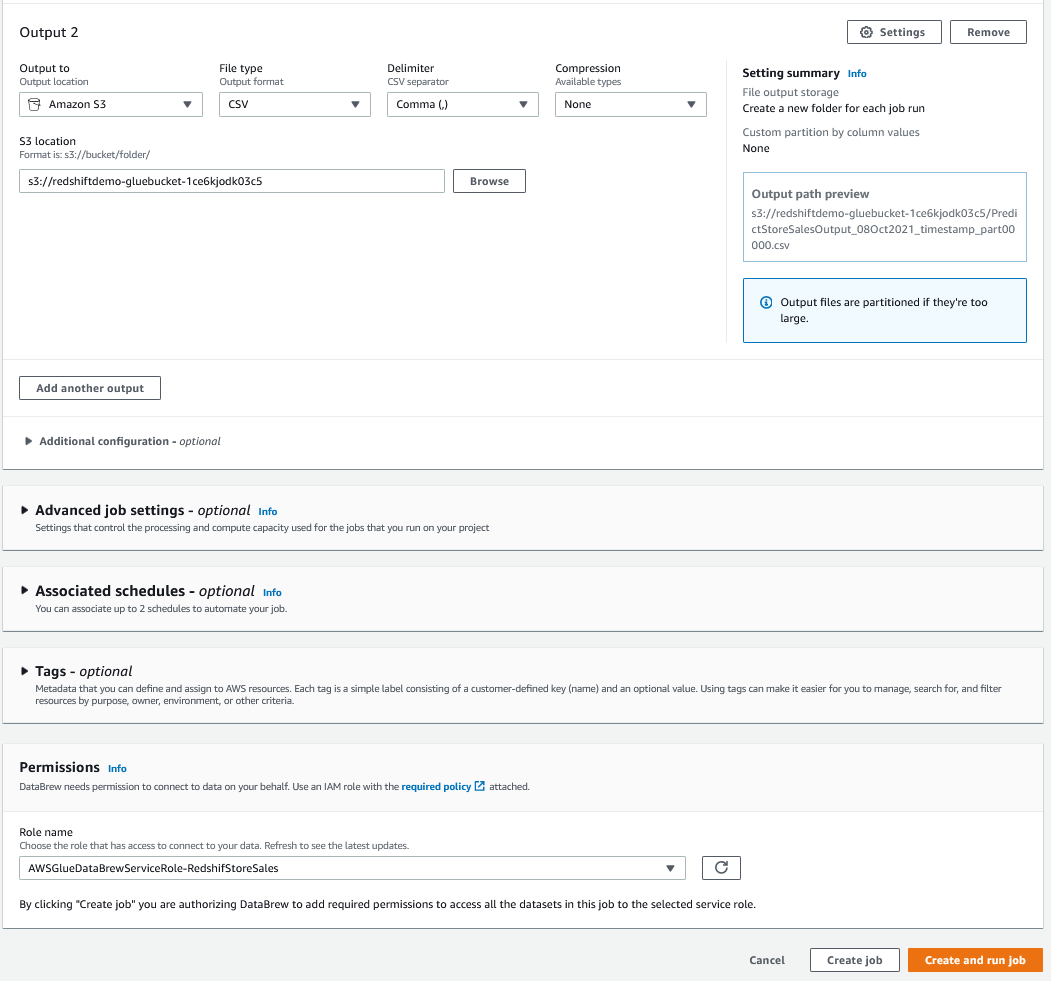
| Sumer would like to add a second output to the Recipe job to extract the cleaned dataset to S3 bucket so that Data Scientists, who intend to use SageMaker or other ML tools have access to the file |
Output to as Amazon S3, and leave the defaultsTaskDataBucketArn as captured from Cloud formation, leave other fields as defaultGlueRoleName as captured from Cloud Formation OutputsCreate and run Job
|
|
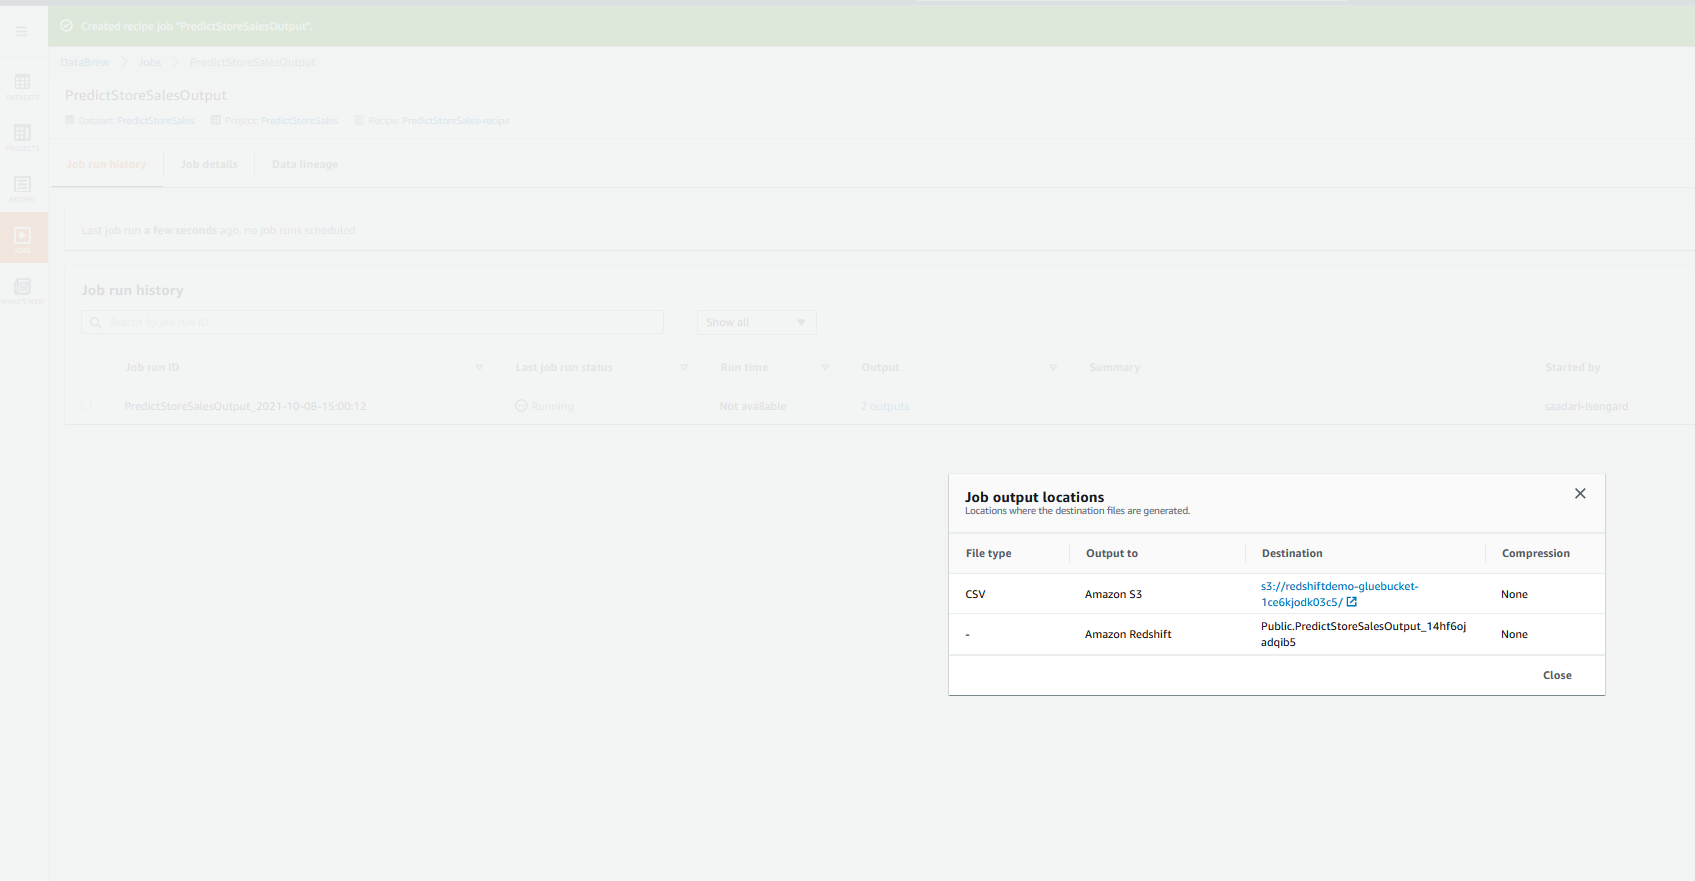
| Sumer would like to capture output locations where the output will be generated |
Jobs menu on the leftOutput to capture Redshift table name with Jobrun id appendedJobrun id to use it in the next step to verify output
|
|
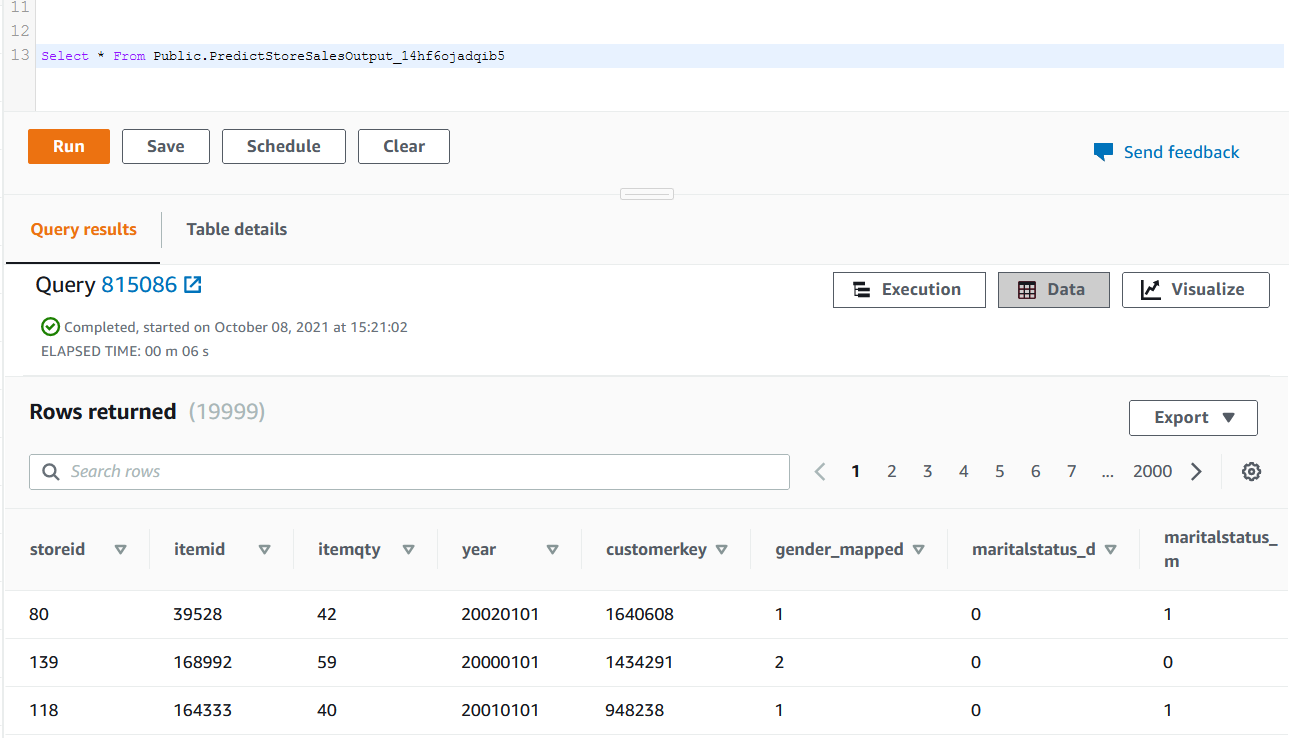
| Sumer would like to verify ouputs in Redshift and S3. If output has been generated after Glue Data Brew recipe job is complete |
Navigate to Redshift Query Editor console and execute this query, replacing <<JobrunId>> with the previously captured Job Id.
|
|
Before you Leave
Execute the following to clear out any changes you made during the demo, replacing <<JobrunId>> with the previously captured Job Id.
DROP TABLE  public.PredictStoreSales;
DROP TABLE  public.PredictStoreSalesOutput_<<JobrunId>>;

create table public.predict_store_sales AS
(select ss_store_sk::Integer,
        ss_item_sk,
        Sum(SS_quantity)::Integer,
        To_Date(dd.d_year, 'YYYY'),
        c.c_first_name String,
        c.c_last_name,
        c.c_customer_sk,
        cd.cd_gender,
        cd.cd_marital_status,
        s.s_store_name,
        s.s_store_id::varchar(50)
from    store_sales ss, date_dim DD, customer c, customer_demographics cd, store s
Where
        ss.ss_sold_date_sk = d_date_sk
        and cd.cd_demo_sk = ss.ss_cdemo_sk
        and c.c_customer_sk = ss.ss_customer_sk
        and s.s_store_sk = ss.ss_store_sk
group By ss_store_sk, ss_item_sk,dd.d_year,cd.cd_gender, cd.cd_marital_status,c.c_first_name, c.c_last_name, c.c_customer_sk,s.s_store_name, s.s_store_id
limit 20000);

update predict_store_sales set "sum" = 4200 where s_store_id = 76 and ss_item_sk = 202080;
Navigate to S3, Search for <<TaskDataBucketArn>> bucket, find PredictStoreSales and delete all objects in it.
If you are done using your cluster, please think about deleting the CFN stack or to avoid having to pay for unused resources do these tasks:
- pause your Redshift Cluster
- Delete Glue Data Brew Project and Jobs.
