Energy forecasting using SageMaker
Demo Video

Client Tool
This demo will use Amazon Sagemaker.
Amazon SageMaker is a fully managed service that provides every developer and data scientist with the ability to build, train, and deploy machine learning (ML) models quickly. SageMaker removes the heavy lifting from each step of the machine learning process to make it easier to develop high quality models.
The screenshots for this demo will leverage the BI Tool of QuickSight. Be sure to complete the BI Tool setup before proceeding.
Please go through Demo preparation first.
Then open notebook smartmeter.ipynb

Challenge
Kim is a Data Scientist at Dextera Energy and she is tasked with forecasting energy consumption based on the smartmeter data collected in the past few years. Kim needs to use the historical meter data to train her model and forecast energy consumption so her company can achieve intelligent scheduling and planning of electricity delivery, and improve customer satisfaction.
To accomplish this Kim will have to do the following steps.
- Data Preparation
- Model Training
- Model Evaluation
- Build ML pipeline
- Transform and share results in Dashboards
SageMaker - ML WorkFlow
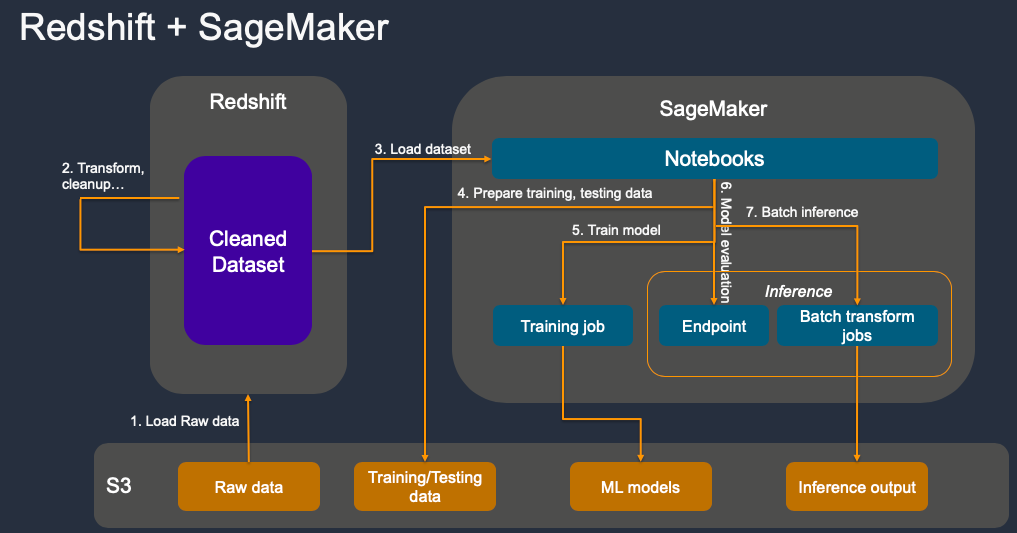
Data Preparation
| Say | Do | Show |
|---|---|---|
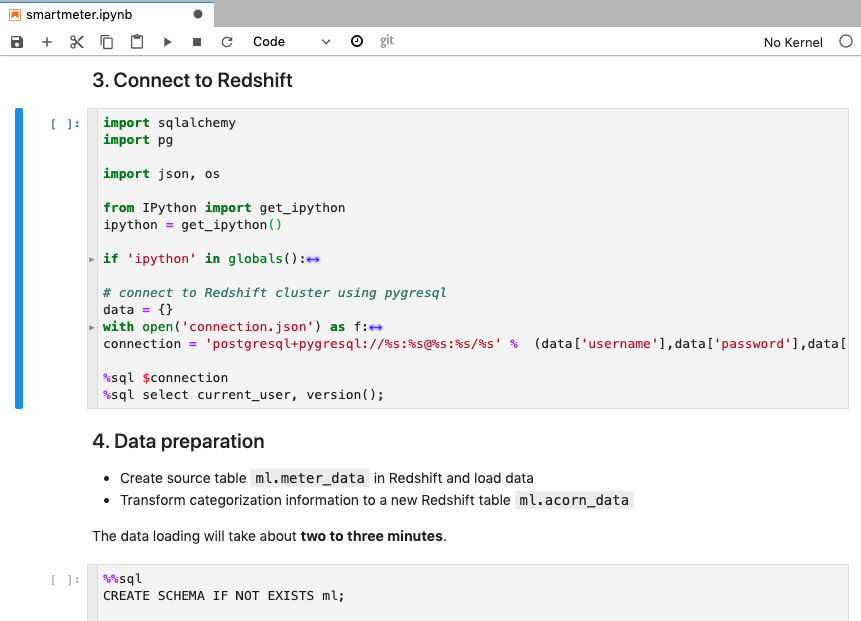
We have years of history meter data stored on s3. First Kim loaded the data into Data warehouse stored in table meter_data. then extract categorical data from it and stored in acorn_data table |
Go to smartmeter notebook and execute step 2, 3, 4. |
|
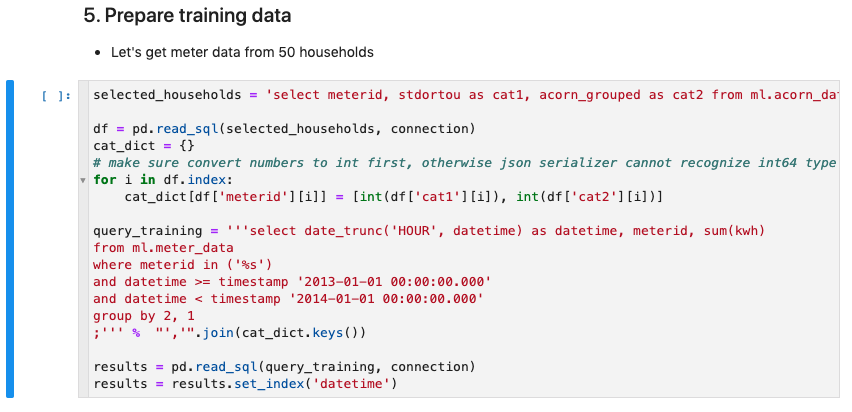
| Kim randomly select meter data from 50 households to build a ML model. The data is originally recorded in 30min interval, which we could use directly. Here we want to forecast longer periods (one week) and need to reduce the data granularity to hourly. So Kim uses Redshift to aggregate the meter data to hourly time series data and load them into Pandas DataFrame. | Go to smartmeter notebook and execute step 5. |
|
|
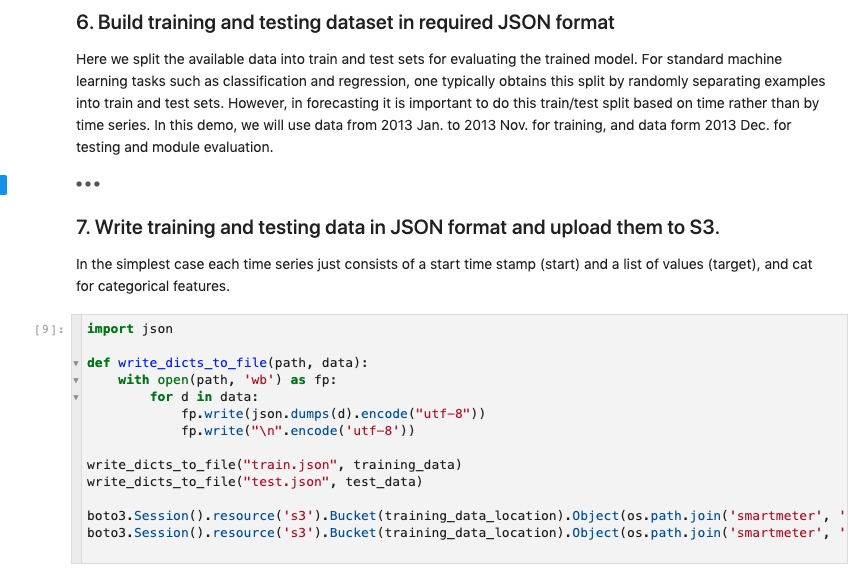
Next, Kim will split this data into train and test sets for training and evaluating the ML model.
In forecasting it is important to do this train/test split based on time rather than by time series. In this demo, we will use data from Jan 2013 to Nov 2013 for training, and data from Dec 2013 for testing and module evaluation. The data is stored in JSON format and uploaded to S3. |
Go to smartmeter notebook and execute step 6 and 7. |
|
Model Training
| Say | Do | Show |
|---|---|---|
|
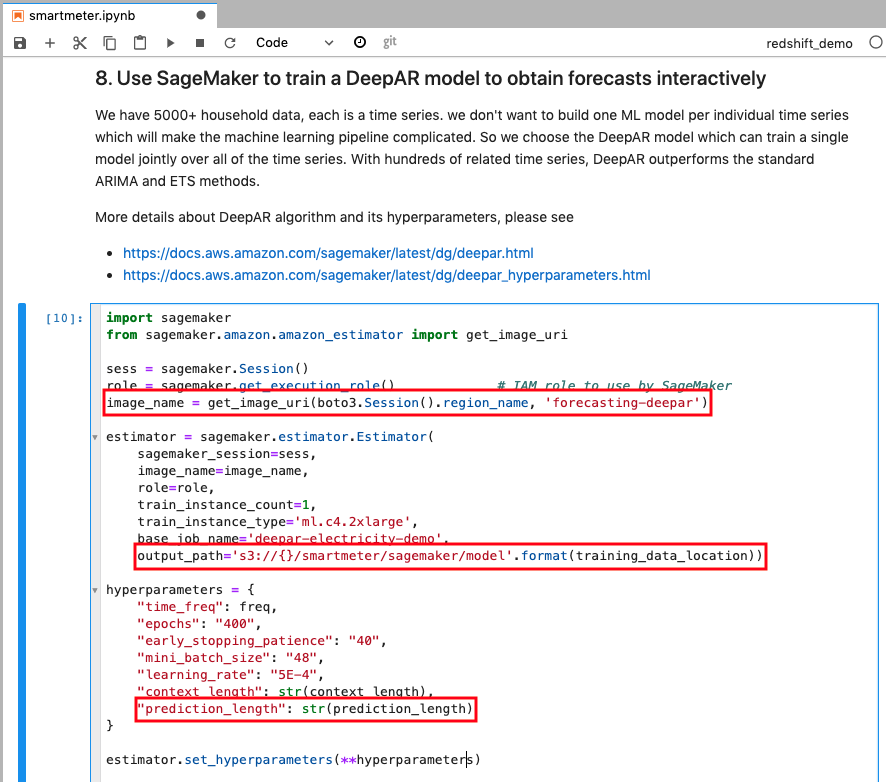
With 5000+ household meter data, each is a time series, Kim doesn’t want to build one ML model per individual time series which will make the machine learning pipeline complicated. So she chose the DeepAR model which can train a single model jointly over all of the time series. With hundreds of related time series, DeepAR outperforms the standard ARIMA and ETS methods.
You can find more details about DeepAR algorithm and its hyperparameters |
Go to smartmeter notebook and execute step 8, explain the marked code, those are ML algorithm used “forecasting-deepar”, model output location, and prediction length. |
|
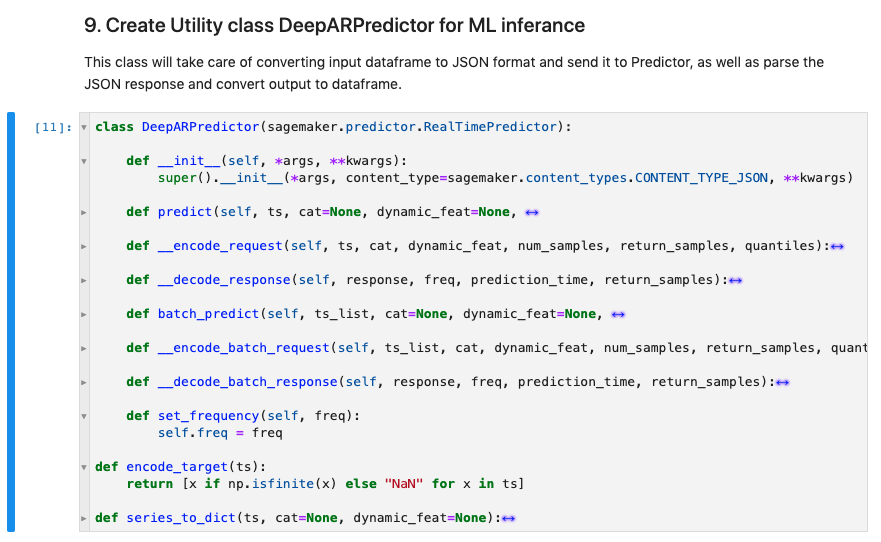
| We will use DeepARPredictor class shown in this screenshot to encode request and decode response. | Go to smartmeter notebook and execute step 9. |
|
|
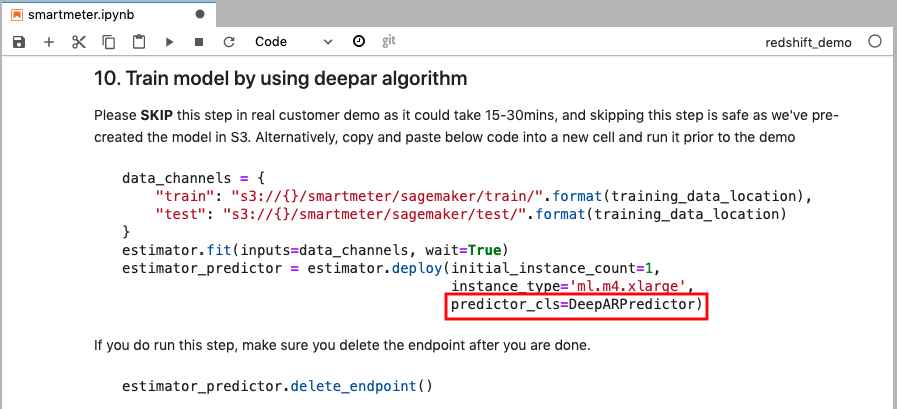
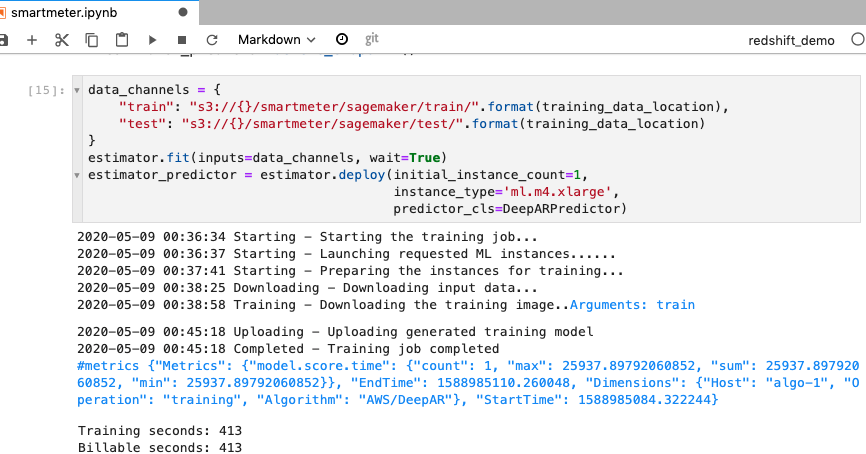
Now with the dataset ready, Kim can start the training and deploy the model. Since this step can take 15-30 minutes, suggest to skip this step, later step will use a pre-trained model so it’s safe to skip it. If you do run this step, do it before the demo. |
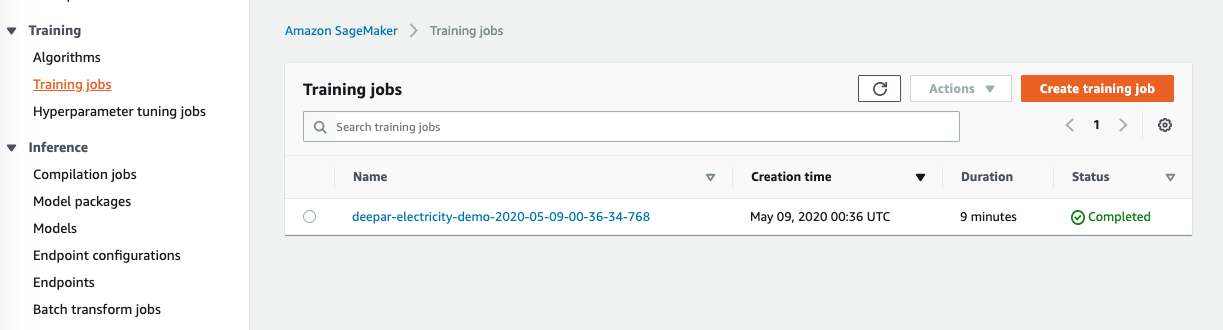
Go to smartmeter notebook and execute step 10.
Show the training result from the cell output and the training job completed from Sagemaker console |
|
Model Evaluation
| Say | Do | Show |
|---|---|---|
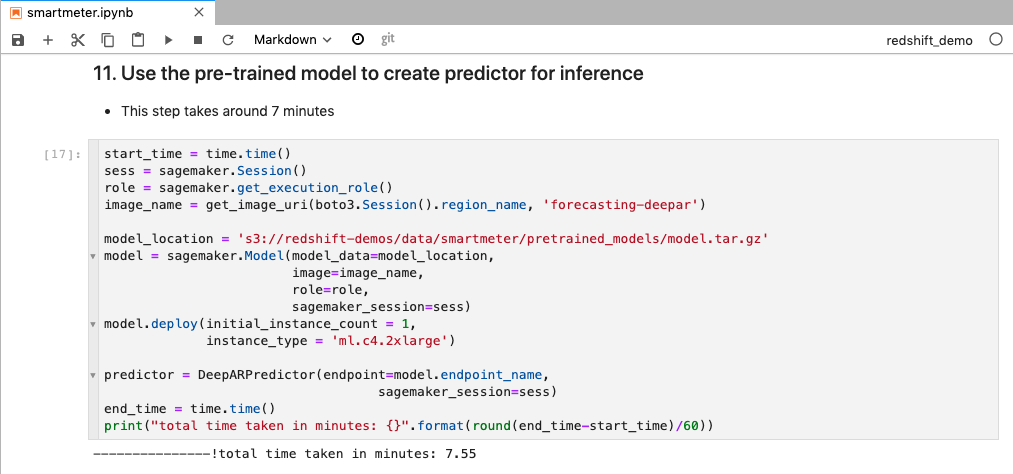
| Now the model is ready, let’s deploy it and evaluate it. We will use the pre-trained model. This step will take 6-8 minutes, suggested to do it before the demo. |
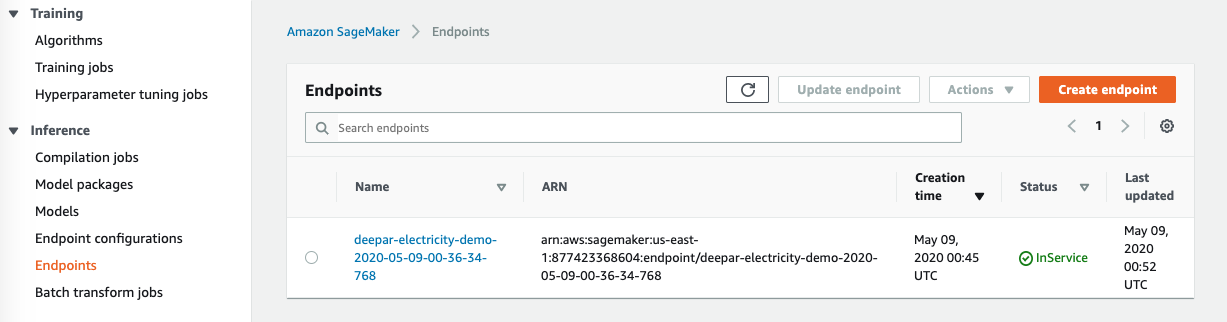
Go to smartmeter notebook and execute step 11.
Go to Sagemaker console to show the deployed endpoint. |
|
|
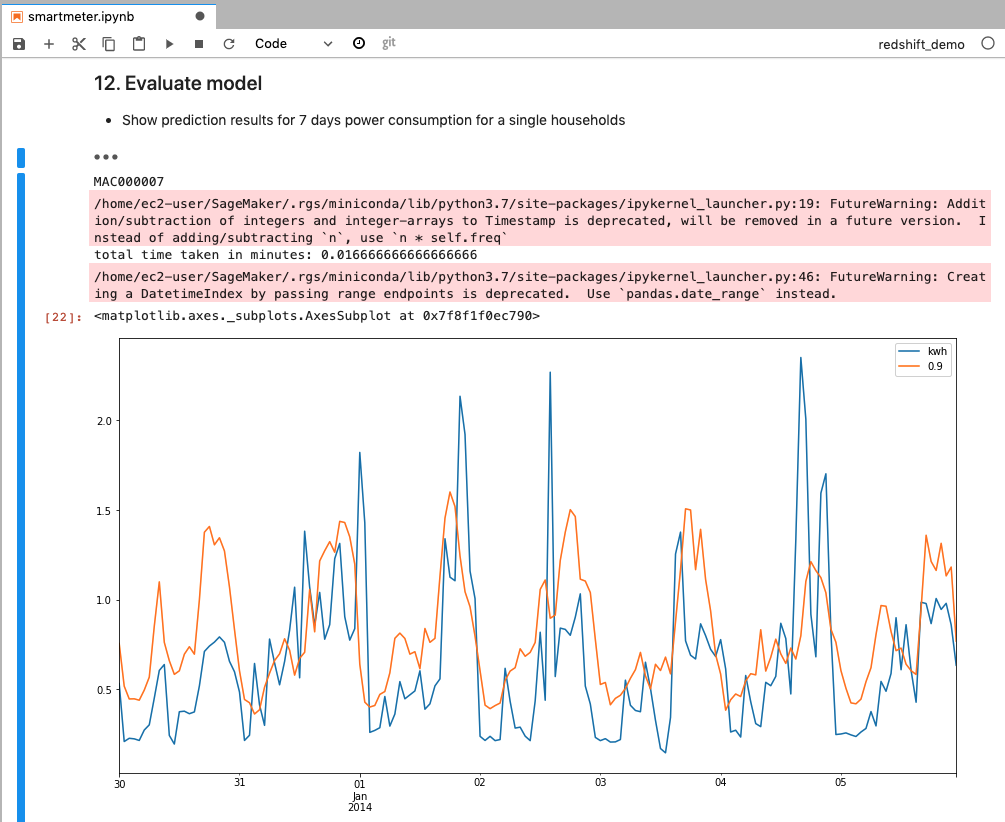
Kim randomly picked one household data to evaluate the model by comparing the forecasting to the actual meter data.
Note: It’s safe to ignore the warning here. |
Go to smartmeter notebook and execute step 12. |
|
Build ML pipeline
| Say | Do | Show |
|---|---|---|
|
Satisfied with the model, Kim wants to build an ML pipeline to do forecasting for all household data weekly. She uses SageMaker batch transform job.
This step will take about 4 minutes. |
Go to smartmeter notebook and execute step 13 and 14.
Once the job is done, go to SageMaker console to show the transform job created. |
|
|
Batch job output will be stored on S3 in JSON format, you can visualize it or load it into Data warehouse for further analysis.
Note: It’s safe to ignore the warning here. |
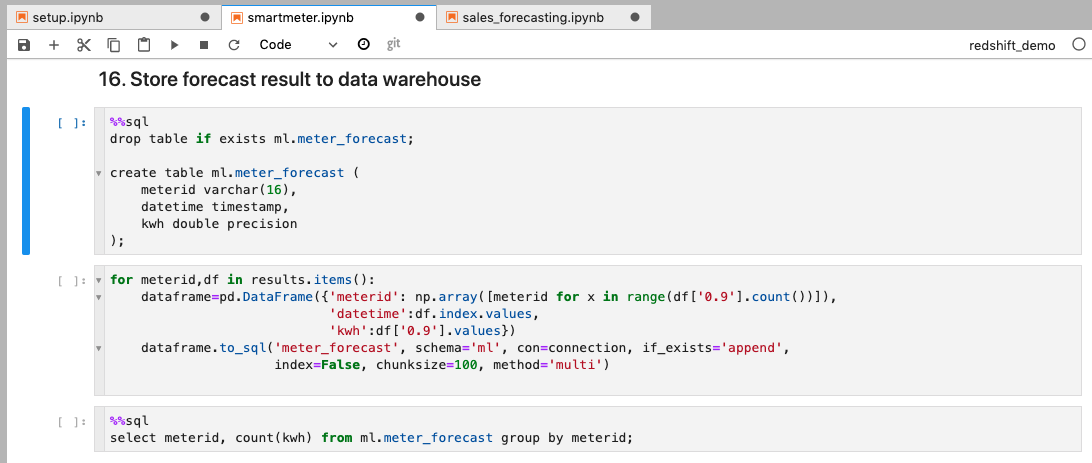
Go to smartmeter notebook and execute step 15. |
|
Transform and share results in Dashboards
| Say | Do | Show |
|---|---|---|
| To analyze the forecast result further and build dashboard on it, Kim stores the result back into Data warehouse. This can be done by using Pandas DataFrame directly if the resultset is small. DataFrame can insert the result to target database in batch. In this demo, We will choose 90% confidence interval for 20 households (meter_id) | Go to smartmeter notebook and execute step 16. |
|
|
Now Kim can visualize the meter forecast and share results with her team.
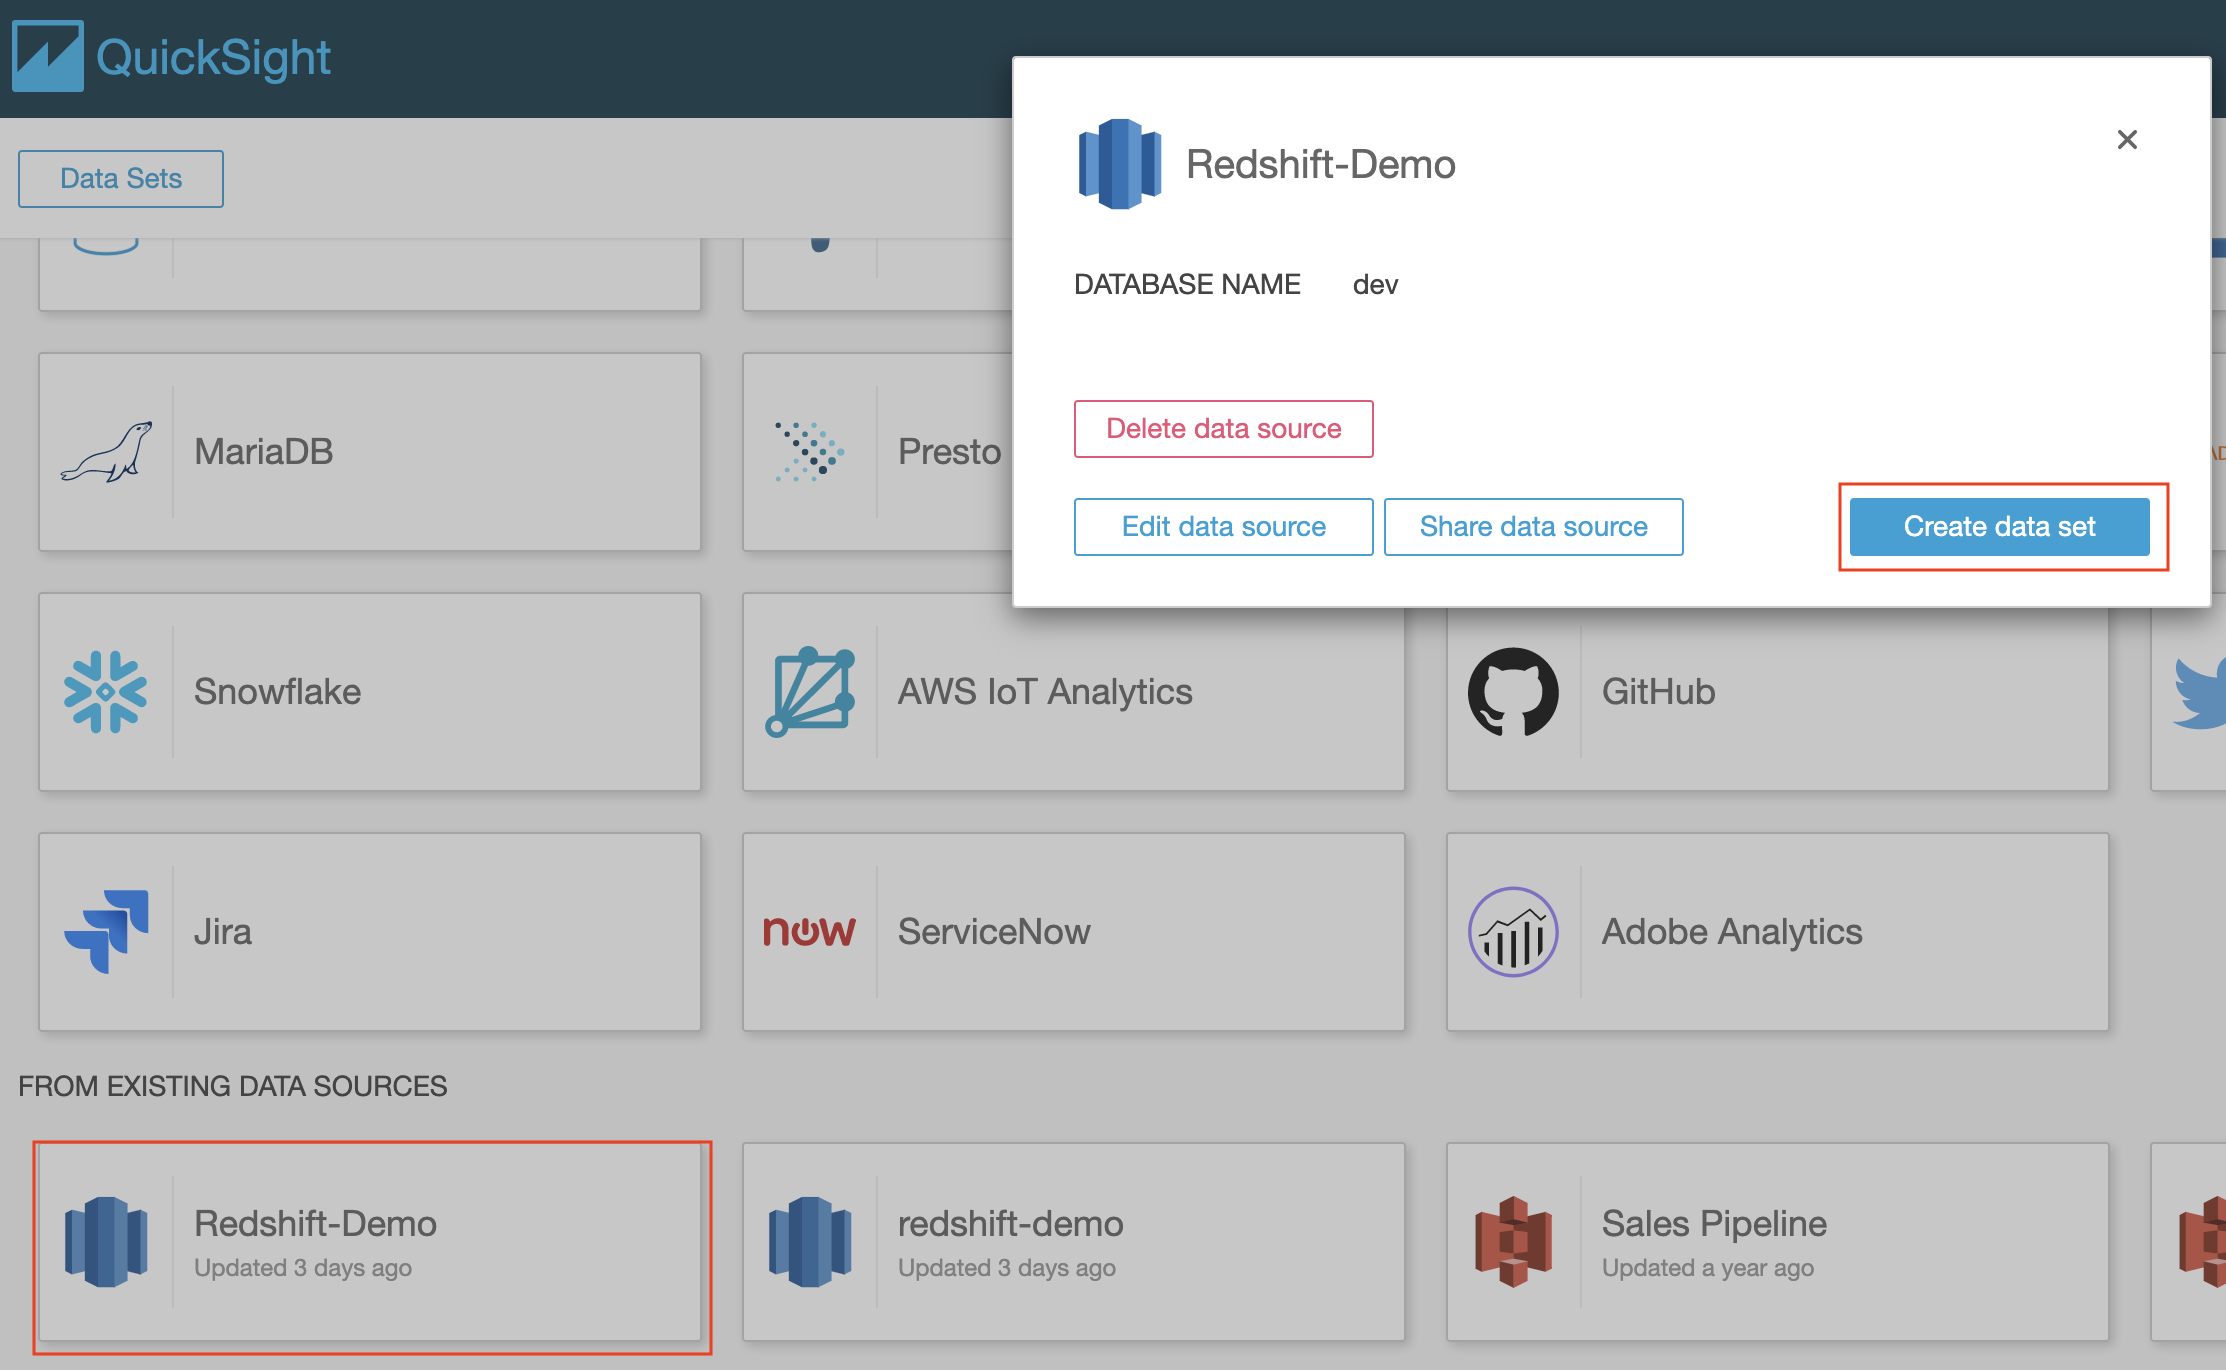
The first step in building a Quicksight Dashboard is to setup the dataset. |
Navigate to Quicksight and Create a new Data Set using the source created earlier. |
|
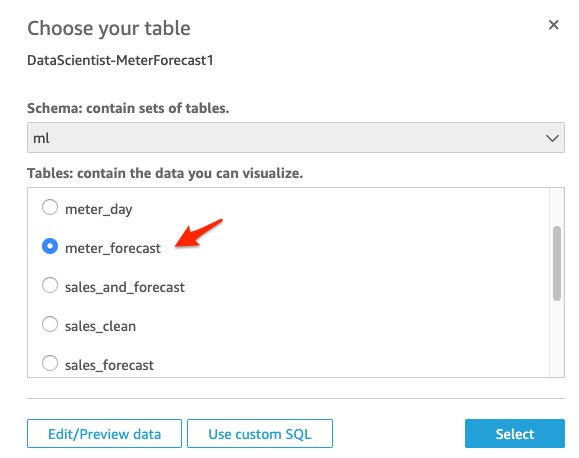
| Choose the “ml” schema and the table “meter_forecast” to visualize the meter forecast. | Select the “ml” schema from the dropdown list and select table “meter_forecast” under the Tables section. Choose “Use custom SQL” |
|
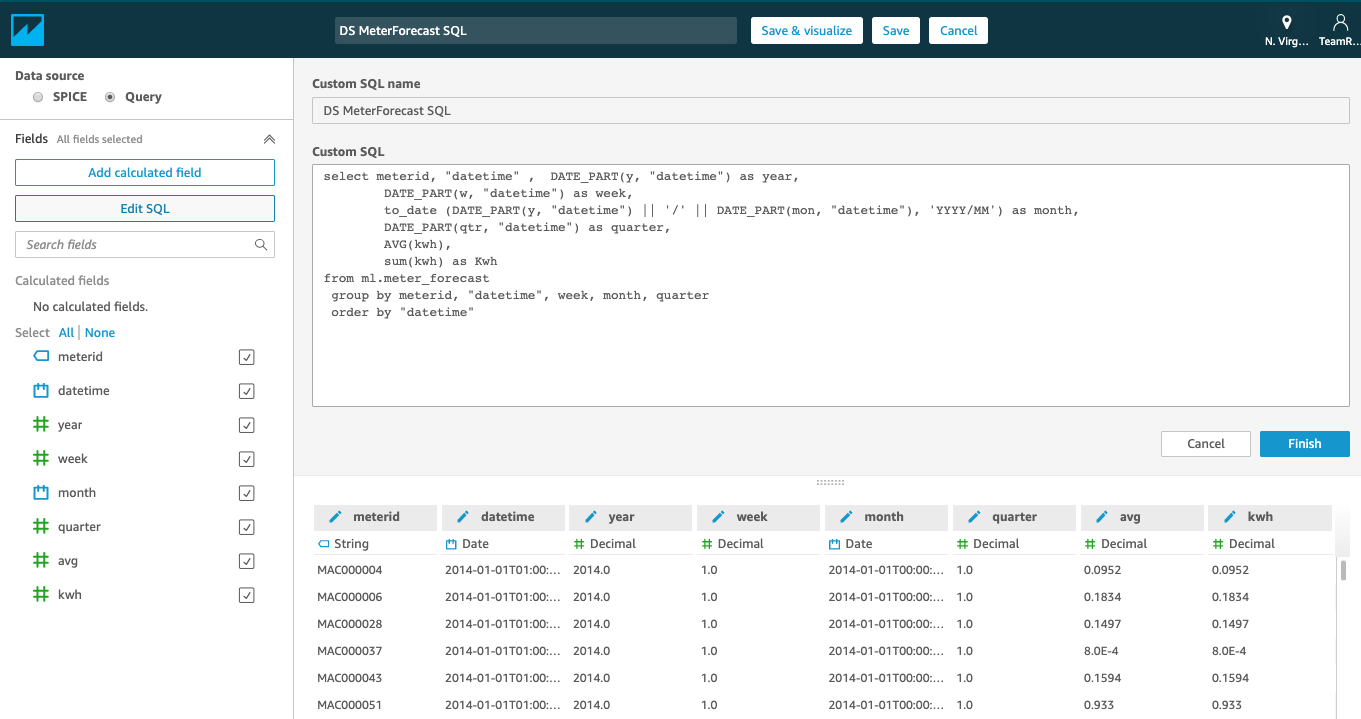
| We will use “Custom SQL” to select the data required and add weekly, monthly buckets |
Name the Query as “DS MeterForecast SQL”, enter the SQL code below into “Custom SQL” section, and click “Confirm query”;
On the next screen click on Visualize button
|
|
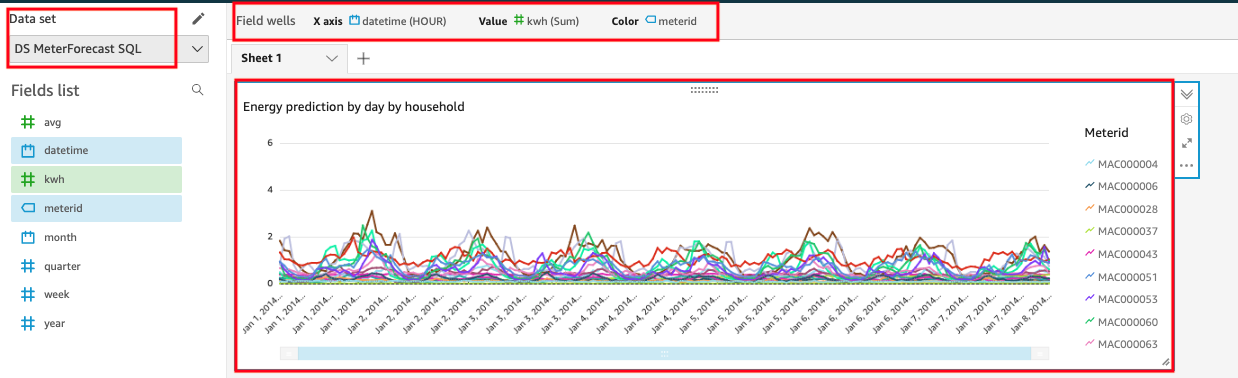
| Next we will add a visual for 7-day Meter data forecast. “Energy predication by household” |
Choose the following parameters for this visual:
|
|
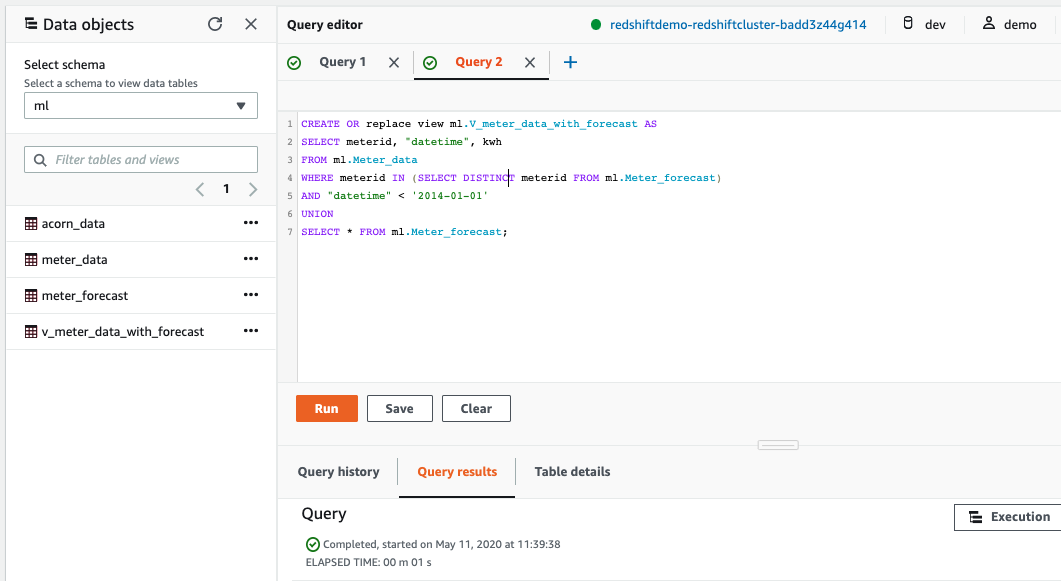
| Kims also wants to show history energy consumption and forecast in one view, then she needs to combine the history and forecast data. For this we can create a view from Redshift data warehouse. |
In Redshift Query Editor, create a view using below SQL
|
|
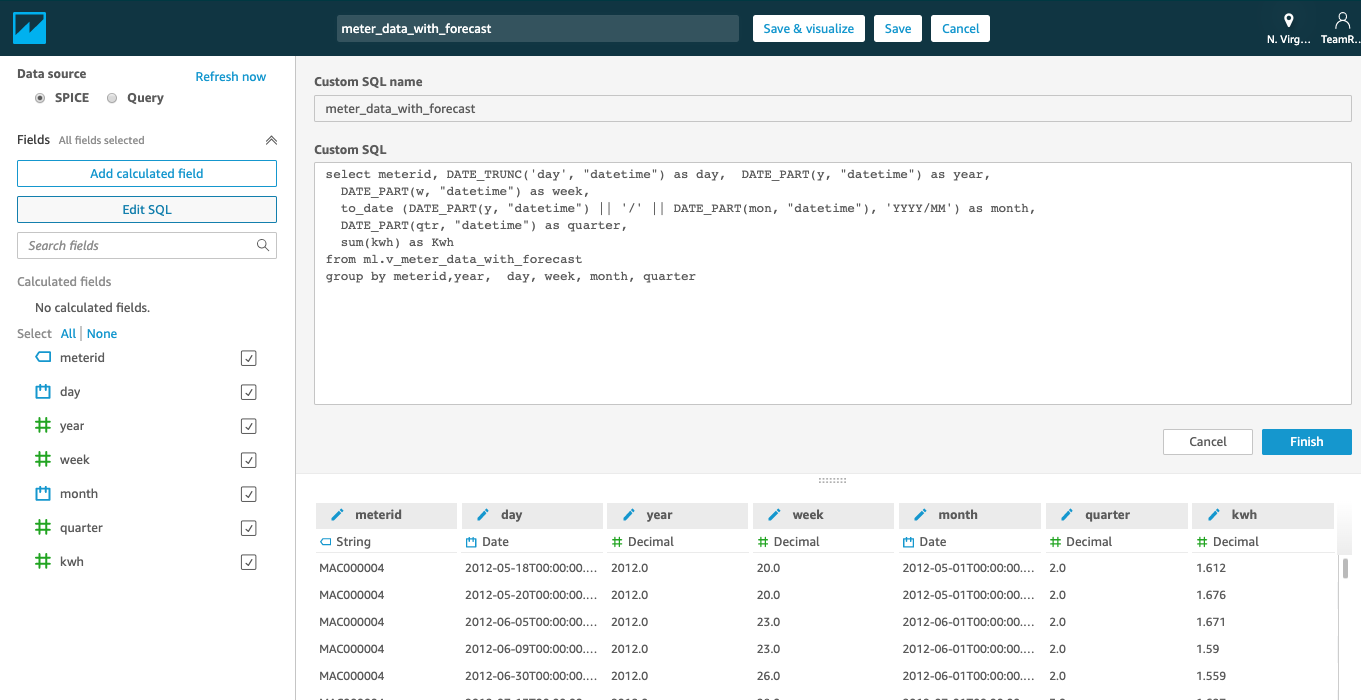
| We will add a second data set called “meter_data_with_forecast”. |
Enter the SQL code below into “Custom SQL” section, and click Finish, and then click on “Save” and name the dataset “meter_data_with_forecast”
|
|
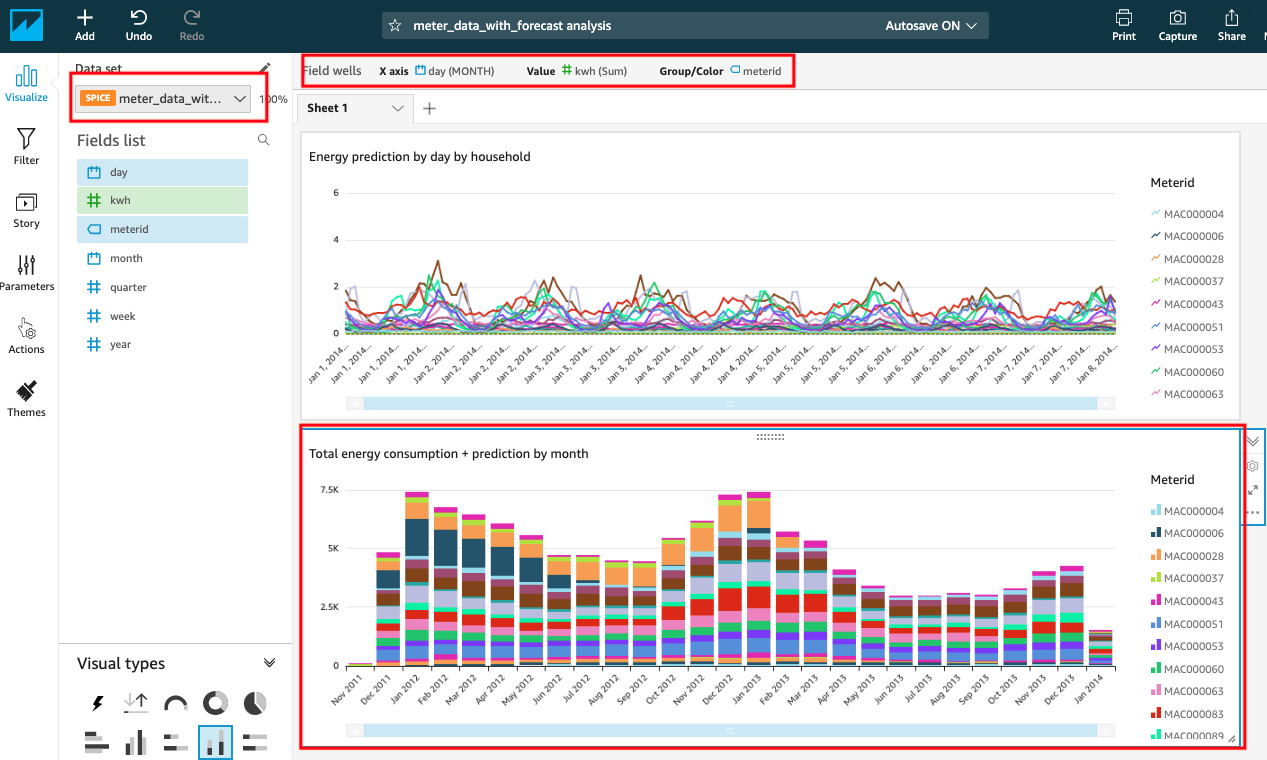
| Add visualizaton to analyze by month, “Total energy consumption + prediction by month”. |
Choose the following parameters for this visual:
|
|
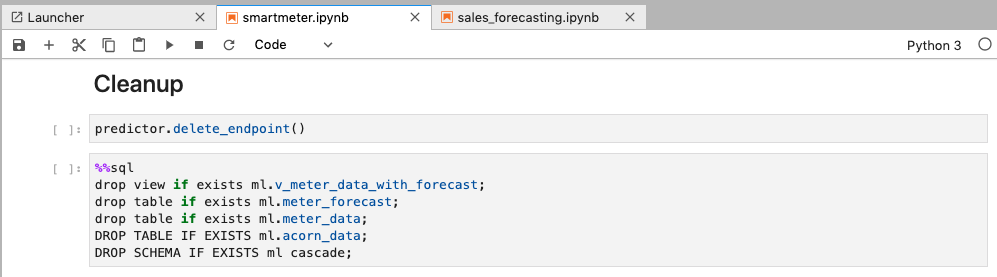
Before you Leave
To clear out any QuickSight changes you made during the demo, delete the Dashboard, Analysis & Data Set you created.
Please execute the Cleanup step to clear out SageMaker Endpoint and any changes you made to Redshift database during the demo.
If you are done using your cluster, please think about deleting the CFN stack or to avoid having to pay for unused resources do these tasks:
- pause your Redshift Cluster
- stop the Oracle database
- stop the DMS task